Zynga 2015 Annual Report Download - page 48
Download and view the complete annual report
Please find page 48 of the 2015 Zynga annual report below. You can navigate through the pages in the report by either clicking on the pages listed below, or by using the keyword search tool below to find specific information within the annual report.-
 1
1 -
2
-
3
-
4
-
5
-
6
-
7
-
8
-
9
-
10
-
11
-
12
-
13
-
14
-
15
-
16
-
17
-
18
-
19
-
20
-
21
-
22
-
23
-
24
-
25
-
26
-
27
-
28
-
29
-
30
-
31
-
32
-
33
-
34
-
35
-
36
-
37
-
 38
38 -
 39
39 -
 40
40 -
 41
41 -
 42
42 -
 43
43 -
 44
44 -
 45
45 -
 46
46 -
 47
47 -
 48
48 -
 49
49 -
 50
50 -
 51
51 -
 52
52 -
 53
53 -
 54
54 -
 55
55 -
 56
56 -
 57
57 -
 58
58 -
59
-
60
-
61
-
62
-
63
-
64
-
65
-
66
-
67
-
68
-
69
-
70
-
71
-
72
-
73
-
74
-
75
-
76
-
77
-
78
-
79
-
80
-
81
-
82
-
83
-
84
-
85
-
86
-
87
-
88
-
89
-
90
-
91
-
92
-
93
-
94
-
95
-
96
-
97
-
98
-
99
-
100
-
101
-
102
-
103
-
104
-
105
-
106
-
107
-
108
-
109
-
110
-
111
-
112
-
113
-
114
-
115
-
116
-
117
-
118
-
119
-
120
-
121
-
122
-
123
-
124
-
125
-
126
-
127
-
128
-
129
-
130
-
131
-
132
-
133
-
134
-
135
-
136
-
137
-
138
-
139
-
140
-
141
-
142
-
143
-
144
-
145
-
146
-
147
-
148
-
149
-
150
-
151
 |
 |

Table of Contents
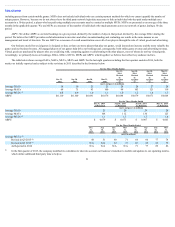
DAUs is the number of individuals who played one of our games during a particular day, as recorded by our internal analytics systems. Average DAUs is the average of the DAUs for each day during the
period reported. See the section titled “Management’s Discussion and Analysis of Financial Condition and Results of Operations—Key Metrics—Key Operating Metrics—DAUs” for more information on
how we define and calculate DAUs.
MAUs is the number of individuals who played a particular game during a 30-day-period, as recorded by our internal analytics systems. Average MAUs is the average of the MAUs at each month-end during
the period reported. See the section titled “Management’s Discussion and Analysis of Financial Condition and Results of Operations—Key Metrics—Key Operating Metrics—MAUs” for more information
on how we define and calculate MAUs.
MUUs is the number of unique individuals who played any of our games on a particular platform during a 30-day period, as recorded by our internal analytics systems. Average MUUs is the average of the
MUUs at each month-end during the period reported. MUUs exclude NaturalMotion legacy games and games from recently acquired Rising Tide as our systems are unable to distinguish whether a player of
these games is also a player of other Zynga games so we exclude payers from these games to avoid potential double counting of MUUs. See the section titled “Management’s Discussion and Analysis of
Financial Condition and Results of Operations—Key Metrics—Key Operating Metrics—MUUs” for more information on how we define and calculate MUUs.
ABPU is defined as our total bookings in a given period, divided by the number of days in that period, divided by the average DAUs during the period. See the section titled “Management’s Discussion and
Analysis of Financial Condition and Results of Operations—Key Metrics—Key Operating Metrics—ABPU” for more information on how we define and calculate ABPU.
In the first quarter of 2015, the company modified its calculation to take into account our business’s transition to mobile and updates to our operating metrics which utilize additional third party data to help
us identify whether a player logged in under two or more accounts is the same individual. As a result of these changes, we revised the definitions for DAUs, MAUs, MUUs, and MUPs in the first quarter of
2015. Additionally, in the third quarter of 2015, the company made a subsequent modification to its calculation of MUUs to further reduce duplication of users of both web and mobile platforms and to
correct an error in calculating the third quarter of 2014 MUU which resulted in MUU for that period to be understated by 0.3 million users. For comparative purposes, the above key operating metrics have
been revised to reflect the company’s current definitions and calculations for all periods presented.
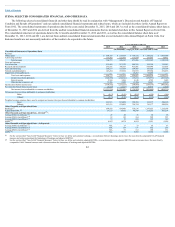
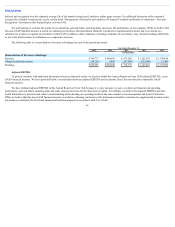
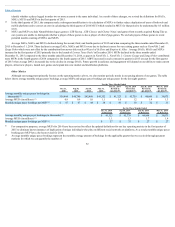
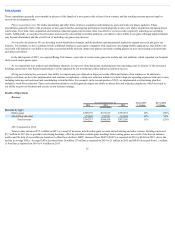
Stock-based expense included in the statements of operations data above was as follows:
Year Ended December 31,
2015 2014 2013 2012 2011
Cost of revenue $ 4,547 $ 4,623 $ 468 $ 12,116 $ 17,660
Research and development 94,548 83,673 61,931 200,640 374,920
Sales and marketing 7,501 5,927 8,079 24,684 81,326
General and administrative 24,979 35,010 13,915 44,546 126,306
Total stock-based compensation $131,575 $ 129,233 $84,393 $ 281,986 $ 600,212
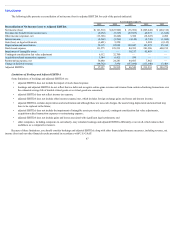
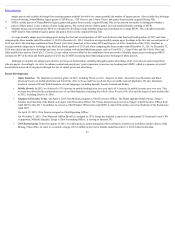
Year Ended December 31,
2015 2014 2013 2012 2011
Consolidated Balance Sheet Data:
Cash, cash equivalents and marketable securities $ 987,250 $1,147,909 $ 1,541,970 $ 1,652,313 $ 1,917,606
Property and equipment, net 273,221 297,919 348,793 466,074 246,740
Working capital 876,084 713,901 964,897 975,225 1,355,224
Total assets 2,124,630 2,348,793 2,279,085 2,576,320 2,516,646
Deferred revenue 129,043 193,805 189,915 347,005 480,645
Total stockholders’ equity (deficit) 1,786,901 1,895,692 1,877,271 1,825,503 1,749,539
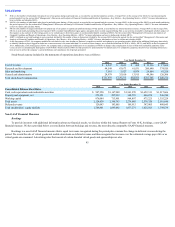
Non-GAAP Financial Measures
Bookings
To provide investors with additional information about our financial results, we disclose within this Annual Report on Form 10-K, bookings, a non-GAAP
financial measure. We have provided below a reconciliation between bookings and revenue, the most directly comparable GAAP financial measure.
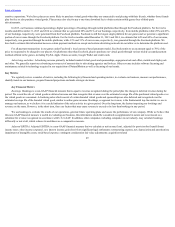
Bookings is a non-GAAP financial measure that is equal to revenue recognized during the period plus or minus the change in deferred revenue during the
period. We record the sale of virtual goods and mobile downloads as deferred revenue and then recognize that revenue over the estimated average payer life or as
virtual goods are consumed. Advertising sales that consist of certain branded virtual goods and sponsorships are also
45
(3)
(4)
(5)
(6)
(7)