Zynga 2015 Annual Report Download - page 52
Download and view the complete annual report
Please find page 52 of the 2015 Zynga annual report below. You can navigate through the pages in the report by either clicking on the pages listed below, or by using the keyword search tool below to find specific information within the annual report.-
 1
1 -
2
-
3
-
4
-
5
-
6
-
7
-
8
-
9
-
10
-
11
-
12
-
13
-
14
-
15
-
16
-
17
-
18
-
19
-
20
-
21
-
22
-
23
-
24
-
25
-
26
-
27
-
28
-
29
-
30
-
31
-
32
-
33
-
34
-
35
-
36
-
37
-
38
-
39
-
40
-
41
-
 42
42 -
 43
43 -
 44
44 -
 45
45 -
 46
46 -
 47
47 -
 48
48 -
 49
49 -
 50
50 -
 51
51 -
 52
52 -
 53
53 -
 54
54 -
 55
55 -
 56
56 -
 57
57 -
 58
58 -
 59
59 -
 60
60 -
 61
61 -
 62
62 -
63
-
64
-
65
-
66
-
67
-
68
-
69
-
70
-
71
-
72
-
73
-
74
-
75
-
76
-
77
-
78
-
79
-
80
-
81
-
82
-
83
-
84
-
85
-
86
-
87
-
88
-
89
-
90
-
91
-
92
-
93
-
94
-
95
-
96
-
97
-
98
-
99
-
100
-
101
-
102
-
103
-
104
-
105
-
106
-
107
-
108
-
109
-
110
-
111
-
112
-
113
-
114
-
115
-
116
-
117
-
118
-
119
-
120
-
121
-
122
-
123
-
124
-
125
-
126
-
127
-
128
-
129
-
130
-
131
-
132
-
133
-
134
-
135
-
136
-
137
-
138
-
139
-
140
-
141
-
142
-
143
-
144
-
145
-
146
-
147
-
148
-
149
-
150
-
151
 |
 |

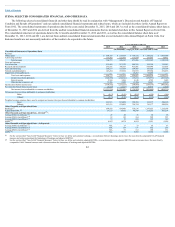
Table of Contents
creative expressions. We believe players are more likely to purchase virtual goods when they are connected to and playing with their friends, whether those friends
play for free or also purchase virtual goods. Players may also elect to pay a one-time download fee to obtain certain mobile games free of third-party
advertisements.
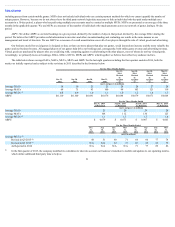
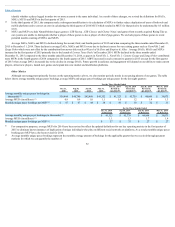
In 2015, our business continued generating a higher percentage of bookings through mobile platforms than through the Facebook platform. For the twelve
months ended December 31, 2015 and 2014 we estimate that we generated 68% and 51% of our bookings, respectively, from mobile platforms while 29% and 43%
of our bookings, respectively, were generated from the Facebook platform. Facebook is still the largest single platform for our games and we generate a significant
portion of our revenue through the Facebook platform. For the twelve months ended December 31, 2015 and 2014, we estimate that 64% and 44% of our revenue,
respectively, was generated through the mobile platforms, while 33% and 51% of our revenue, respectively, was generated through the Facebook platform. We
have had to estimate this information because certain payment methods we accept and certain advertising networks do not allow us to determine the platform used.
For all payment transactions in our games under Facebook’s local currency-based payments model, Facebook remits to us an amount equal to 70% of the
price we requested to be charged to our players. On platforms other than Facebook, players purchase our virtual goods through various widely accepted payment
methods offered in the games, including PayPal, Apple iTunes accounts, Google Wallet and credit cards.
Advertising and other. Advertising revenue primarily includes branded virtual goods and sponsorships, engagement ads and offers, mobile and display ads
and other. We generally report our advertising revenue net of amounts due to advertising agencies and brokers. Other revenue includes software licensing and
maintenance related to technology acquired in our acquisition of NaturalMotion as well as licensing of our brands.
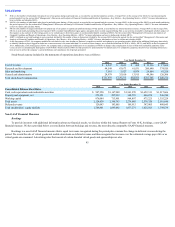
Key Metrics
We regularly review a number of metrics, including the following key financial and operating metrics, to evaluate our business, measure our performance,
identify trends in our business, prepare financial projections and make strategic decisions.
KeyFinancialMetrics
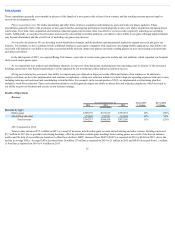
Bookings. Bookings is a non-GAAP financial measure that is equal to revenue recognized during the period plus the change in deferred revenue during the
period. We record the sale of virtual goods as deferred revenue and then recognize that revenue over the estimated average life of the purchased virtual goods or as
the virtual goods are consumed. Advertising sales which consist of certain branded virtual goods and sponsorships are also deferred and recognized over the
estimated average life of the branded virtual good, similar to online game revenue. Bookings, as opposed to revenue, is the fundamental top-line metric we use to
manage our business, as we believe it is a useful indicator of the sales activity in a given period. Over the long-term, the factors impacting our bookings and
revenue are the same. However, in the short term, there are factors that may cause revenue to exceed or be less than bookings in any period.
We use bookings to evaluate the results of our operations, generate future operating plans and assess the performance of our company. While we believe that
this non-GAAP financial measure is useful in evaluating our business, this information should be considered as supplemental in nature and is not meant as a
substitute for revenue recognized in accordance with U.S. GAAP. In addition, other companies, including companies in our industry, may calculate bookings
differently or not at all, which reduces its usefulness as a comparative measure.
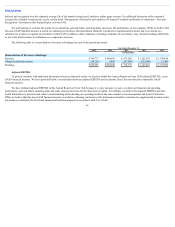
Adjusted EBITDA. Adjusted EBITDA is a non-GAAP financial measure that we calculate as net income (loss), adjusted for provision for (benefit from)
income taxes; other income (expense), net; interest income; gain (loss) from significant legal settlements; restructuring expense, net; depreciation and amortization;
impairment of intangible assets; stock-based expense; contingent consideration fair value adjustments; acquisition-related
49