Zynga 2015 Annual Report Download - page 51
Download and view the complete annual report
Please find page 51 of the 2015 Zynga annual report below. You can navigate through the pages in the report by either clicking on the pages listed below, or by using the keyword search tool below to find specific information within the annual report.-
 1
1 -
2
-
3
-
4
-
5
-
6
-
7
-
8
-
9
-
10
-
11
-
12
-
13
-
14
-
15
-
16
-
17
-
18
-
19
-
20
-
21
-
22
-
23
-
24
-
25
-
26
-
27
-
28
-
29
-
30
-
31
-
32
-
33
-
34
-
35
-
36
-
37
-
38
-
39
-
40
-
 41
41 -
 42
42 -
 43
43 -
 44
44 -
 45
45 -
 46
46 -
 47
47 -
 48
48 -
 49
49 -
 50
50 -
 51
51 -
 52
52 -
 53
53 -
 54
54 -
 55
55 -
 56
56 -
 57
57 -
 58
58 -
 59
59 -
 60
60 -
 61
61 -
62
-
63
-
64
-
65
-
66
-
67
-
68
-
69
-
70
-
71
-
72
-
73
-
74
-
75
-
76
-
77
-
78
-
79
-
80
-
81
-
82
-
83
-
84
-
85
-
86
-
87
-
88
-
89
-
90
-
91
-
92
-
93
-
94
-
95
-
96
-
97
-
98
-
99
-
100
-
101
-
102
-
103
-
104
-
105
-
106
-
107
-
108
-
109
-
110
-
111
-
112
-
113
-
114
-
115
-
116
-
117
-
118
-
119
-
120
-
121
-
122
-
123
-
124
-
125
-
126
-
127
-
128
-
129
-
130
-
131
-
132
-
133
-
134
-
135
-
136
-
137
-
138
-
139
-
140
-
141
-
142
-
143
-
144
-
145
-
146
-
147
-
148
-
149
-
150
-
151
 |
 |

Table of Contents
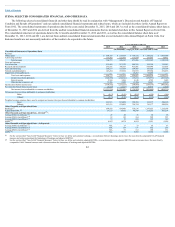
ITEM 7. MANAGEMENT’S DISCUSSION AND ANALYSIS OF FINANCIAL CONDITION AND RESULTS OF OPERATIONS
You should read the following discussion of our financial condition and results of operations in conjunction with the consolidated financial statements and
the related notes included elsewhere in this Annual Report on Form 10-K. The following discussion contains forward-looking statements that reflect our plans,
estimates and beliefs. Our actual results could differ materially from those discussed in the forward-looking statements. Factors that could cause or contribute to
these differences include those discussed below and elsewhere in this Annual Report on Form 10-K, particularly in “Special Note Regarding Forward-Looking
Statements” and “Risk Factors.”
Overview
We are a leading social game developer with approximately 68 million average MAUs for the three months ended December 31, 2015. We have launched
some of the most successful social games in the industry. Our games are accessible on mobile platforms, Facebook and other social networks and Zynga.com. Our
games are generally available for free, and we generate revenue through the in-game sale of virtual goods and advertising services.
We are a pioneer and innovator of social games and a leader in making play a core activity on the Internet. Our objective is to become the worldwide leader
in play by connecting the world through games.
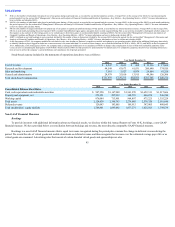
Consistent with our free-to-play business model, compared to all players who play our games in any period, only a small portion of our players are payers.
Because the opportunity for social interactions increases as the number of players increases, we believe that maintaining and growing our overall number of
players, including the number of players who may not purchase virtual goods, is important to the success of our business. As a result, we believe that the number of
players who choose to purchase virtual goods will continue to constitute a small portion of our overall players.
The games that constitute our top games vary over time but historically the top three online game revenue-generating games in any period contributed the
majority of our revenue. Our top three games accounted for 53%, 60% and 54% of our online game revenue in 2015, 2014 and 2013, respectively.
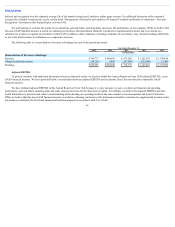
In 2015, we continued to align our cost-structure with our key strategic initiatives. We reduced our headcount from 1,974, as of December 31, 2014, to
1,669, as of December 31, 2015, we consolidated certain facilities and data centers and we migrated a significant portion of our computing to run on hosting and
cloud computer services provided by third parties. We continue to invest in game development, creating both new games and new features and content in existing
games designed to engage our players on mobile devices and on the web.
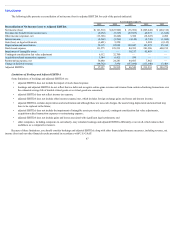
How We Generate Revenue
We operate our games as live services that allow players to play for free. We generate revenue primarily from the in-game sale of virtual goods and
advertising services. Revenue growth will depend largely on our ability to attract and retain players and more effectively monetize our player base through the sale
of virtual goods and advertising. We intend to do this through the launch of new games, enhancements to current games and expansion into new markets and
distribution platforms.
Online game. We provide our players with the opportunity to purchase virtual goods that enhance their game-playing experience. We believe players choose
to pay for virtual goods for the same reasons they are willing to pay for other forms of entertainment—they enjoy the additional playing time or added convenience,
the ability to personalize their own game boards, the satisfaction of leveling up and the opportunity for sharing
48