Zynga 2015 Annual Report Download - page 50
Download and view the complete annual report
Please find page 50 of the 2015 Zynga annual report below. You can navigate through the pages in the report by either clicking on the pages listed below, or by using the keyword search tool below to find specific information within the annual report.-
 1
1 -
2
-
3
-
4
-
5
-
6
-
7
-
8
-
9
-
10
-
11
-
12
-
13
-
14
-
15
-
16
-
17
-
18
-
19
-
20
-
21
-
22
-
23
-
24
-
25
-
26
-
27
-
28
-
29
-
30
-
31
-
32
-
33
-
34
-
35
-
36
-
37
-
38
-
39
-
 40
40 -
 41
41 -
 42
42 -
 43
43 -
 44
44 -
 45
45 -
 46
46 -
 47
47 -
 48
48 -
 49
49 -
 50
50 -
 51
51 -
 52
52 -
 53
53 -
 54
54 -
 55
55 -
 56
56 -
 57
57 -
 58
58 -
 59
59 -
 60
60 -
61
-
62
-
63
-
64
-
65
-
66
-
67
-
68
-
69
-
70
-
71
-
72
-
73
-
74
-
75
-
76
-
77
-
78
-
79
-
80
-
81
-
82
-
83
-
84
-
85
-
86
-
87
-
88
-
89
-
90
-
91
-
92
-
93
-
94
-
95
-
96
-
97
-
98
-
99
-
100
-
101
-
102
-
103
-
104
-
105
-
106
-
107
-
108
-
109
-
110
-
111
-
112
-
113
-
114
-
115
-
116
-
117
-
118
-
119
-
120
-
121
-
122
-
123
-
124
-
125
-
126
-
127
-
128
-
129
-
130
-
131
-
132
-
133
-
134
-
135
-
136
-
137
-
138
-
139
-
140
-
141
-
142
-
143
-
144
-
145
-
146
-
147
-
148
-
149
-
150
-
151
 |
 |
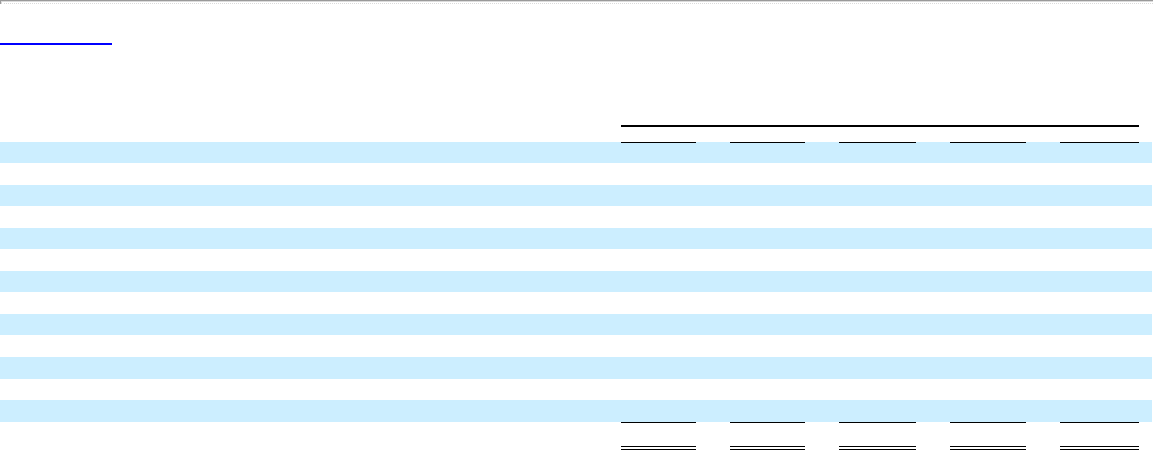
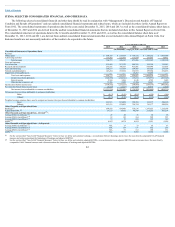
Table of Contents
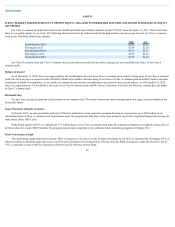
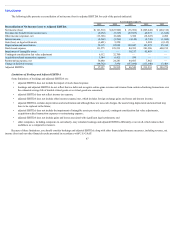
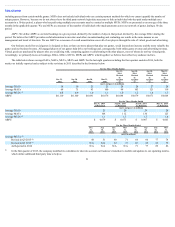
The following table presents a reconciliation of net income (loss) to adjusted EBITDA for each of the periods indicated:
Year Ended December 31,
2015 2014 2013 2012 2011
Reconciliation of Net Income (Loss) to Adjusted EBITDA:
Net income (loss) $ (121,510) $ (225,900) $ (36,982) $ (209,448) $ (404,316)
Provision for (benefit from) income taxes (8,672) (7,327) (27,887) 49,873 (1,826)
Other income (expense), net (13,306) (8,248) 3,386 (18,647) 2,206
Interest income (2,568) (3,266) (4,148) (4,749) (1,680)
Gain (loss) on legal settlements (1,681) 5,250 — 3,024 (2,145)
Depreciation and amortization 54,315 82,894 129,047 141,479 95,414
Stock-based expense 131,575 129,233 84,393 281,986 600,212
Impairment of intangible assets — — 10,217 95,493 —
Contingent consideration fair value adjustment 6,112 32,700 — — —
Acquisition-related transaction expenses 1,144 6,425 930 — —
Restructuring expense, net 36,480 24,281 44,683 7,862 —
Change in deferred revenue (64,762) 3,890 (157,090) (133,640) 15,409
Adjusted EBITDA $ 17,127 $ 39,932 $ 46,549 $ 213,233 $ 303,274
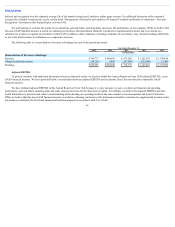
LimitationsofBookingsandAdjustedEBITDA
Some limitations of bookings and adjusted EBITDA are:
• adjusted EBITDA does not include the impact of stock-based expense;
• bookings and adjusted EBITDA do not reflect that we defer and recognize online game revenue and revenue from certain advertising transactions over
the estimated average life of durable virtual goods or as virtual goods are consumed;
• adjusted EBITDA does not reflect income tax expense;
• adjusted EBITDA does not include other income (expense) net, which includes foreign exchange gains and losses and interest income;
• adjusted EBITDA excludes depreciation and amortization and although these are non-cash charges, the assets being depreciated and amortized may
have to be replaced in the future;
• adjusted EBITDA does not include the impairment of intangible assets previously acquired, contingent consideration fair value adjustments,
acquisition-related transaction expenses or restructuring expense;
• adjusted EBITDA does not include gains and losses associated with significant legal settlements; and
• other companies, including companies in our industry, may calculate bookings and adjusted EBITDA differently or not at all, which reduces their
usefulness as a comparative measure.
Because of these limitations, you should consider bookings and adjusted EBITDA along with other financial performance measures, including revenue, net
income (loss) and our other financial results presented in accordance with U.S. GAAP.
47