Zynga 2015 Annual Report Download - page 47
Download and view the complete annual report
Please find page 47 of the 2015 Zynga annual report below. You can navigate through the pages in the report by either clicking on the pages listed below, or by using the keyword search tool below to find specific information within the annual report.-
 1
1 -
2
-
3
-
4
-
5
-
6
-
7
-
8
-
9
-
10
-
11
-
12
-
13
-
14
-
15
-
16
-
17
-
18
-
19
-
20
-
21
-
22
-
23
-
24
-
25
-
26
-
27
-
28
-
29
-
30
-
31
-
32
-
33
-
34
-
35
-
36
-
 37
37 -
 38
38 -
 39
39 -
 40
40 -
 41
41 -
 42
42 -
 43
43 -
 44
44 -
 45
45 -
 46
46 -
 47
47 -
 48
48 -
 49
49 -
 50
50 -
 51
51 -
 52
52 -
 53
53 -
 54
54 -
 55
55 -
 56
56 -
 57
57 -
58
-
59
-
60
-
61
-
62
-
63
-
64
-
65
-
66
-
67
-
68
-
69
-
70
-
71
-
72
-
73
-
74
-
75
-
76
-
77
-
78
-
79
-
80
-
81
-
82
-
83
-
84
-
85
-
86
-
87
-
88
-
89
-
90
-
91
-
92
-
93
-
94
-
95
-
96
-
97
-
98
-
99
-
100
-
101
-
102
-
103
-
104
-
105
-
106
-
107
-
108
-
109
-
110
-
111
-
112
-
113
-
114
-
115
-
116
-
117
-
118
-
119
-
120
-
121
-
122
-
123
-
124
-
125
-
126
-
127
-
128
-
129
-
130
-
131
-
132
-
133
-
134
-
135
-
136
-
137
-
138
-
139
-
140
-
141
-
142
-
143
-
144
-
145
-
146
-
147
-
148
-
149
-
150
-
151
 |
 |

Table of Contents
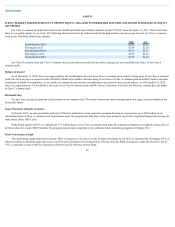
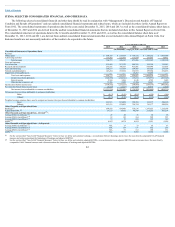
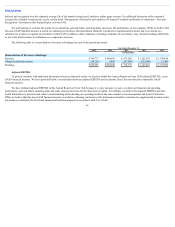
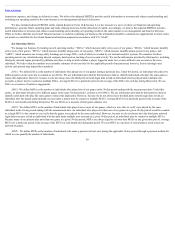
ITEM 6. SELECTED CONSOLIDATED FINANCIAL AND OTHER DATA
The following selected consolidated financial and other data should be read in conjunction with “Management’s Discussion and Analysis of Financial
Condition and Results of Operations” and our audited consolidated financial statements and related notes, which are included elsewhere in this Annual Report on
Form 10-K. The consolidated statements of operations data for the years ended December 31, 2015, 2014 and 2013 as well as the consolidated balance sheet data as
of December 31, 2015 and 2014 are derived from the audited consolidated financial statements that are included elsewhere in this Annual Report on Form 10-K.
The consolidated statement of operations data for the 12 months ended December 31, 2012 and 2011, as well as the consolidated balance sheet data as of
December 31, 2013, 2012 and 2011, are derived from audited consolidated financial statements that are not included in this Annual Report on Form 10-K. Our
historical results are not necessarily indicative of the results to be expected in the future.
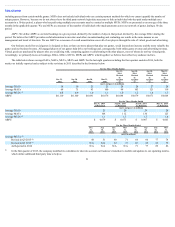
Year Ended December 31,
2015 2014 2013 2012 2011
(in thousands, except per share, user and ABPU data)
Consolidated Statements of Operations Data:
Revenue:
Online game $ 590,755 $ 537,619 $ 759,572 $ 1,144,252 $ 1,065,648
Advertising and other 173,962 152,791 113,694 137,015 74,452
Total revenue 764,717 690,410 873,266 1,281,267 1,140,100
Costs and expenses:
Cost of revenue 235,985 213,570 248,358 352,169 330,043
Research and development 361,931 396,553 413,001 645,648 727,018
Sales and marketing 169,573 157,364 104,403 181,924 234,199
General and administrative 143,284 167,664 162,918 189,004 254,456
Impairment of intangible assets — — 10,217 95,493 —
Total costs and expenses 910,773 935,151 938,897 1,464,238 1,545,716
Income (loss) from operations (146,056) (244,741) (65,631) (182,971) (405,616)
Interest income 2,568 3,266 4,148 4,749 1,680
Other income (expense), net 13,306 8,248 (3,386) 18,647 (2,206)
Income (loss) before income taxes (130,182) (233,227) (64,869) (159,575) (406,142)
Provision for (benefit from) income taxes (8,672) (7,327) (27,887) 49,873 (1,826)
Net income (loss) attributable to common stockholders $ (121,510) $ (225,900) $ (36,982) $ (209,448) $ (404,316)
Net income (loss) per share attributable to common stockholders
Basic $ (0.13) $ (0.26) $ (0.05) $ (0.28) $ (1.40)
Diluted $ (0.13) $ (0.26) $ (0.05) $ (0.28) $ (1.40)
Weighted average common shares used to compute net income (loss) per share attributable to common stockholders:
Basic 913,511 874,509 799,794 741,177 288,599
Diluted 913,511 874,509 799,794 741,177 288,599
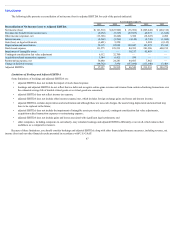
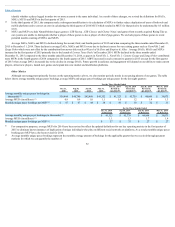
Other Financial and Operational Data:
Bookings 699,955 694,300 716,176 1,147,627 1,155,509
Adjusted EBITDA 17,127 39,932 46,549 213,233 303,274
Other Financial and Operational Data—Revised :
Average DAUs (in millions) 21 26 36 62 56
Average MAUs (in millions) 81 110 164 288 225
Average MUUs (in millions) 57 70 104 159 149
ABPU 0.093 0.074 0.054 0.051 0.056
Other Financial and Operational Data—As Reported:
Average DAUs (in millions) N/A 27 37 63 57
Average MAUs (in millions) N/A 118 171 302 233
Average MUUs (in millions) N/A 81 112 180 151
ABPU N/A 0.071 0.053 0.050 0.055
See the section titled “Non-GAAP Financial Measures” below for how we define and calculate bookings, a reconciliation between bookings and revenue, the most directly comparable GAAP financial
measure and a discussion about the limitations of bookings and adjusted EBITDA.
See the section titled “Non-GAAP Financial Measures” below for how we define and calculate adjusted EBITDA, a reconciliation between adjusted EBITDA and net income (loss), the most directly
comparable GAAP financial measure and a discussion about the limitations of bookings and adjusted EBITDA.
44
(1)
(2)
(7)
(3)
(4)
(5)
(6)
(3)
(4)
(5)
(6)
(1)
(2)