Zynga 2015 Annual Report Download - page 82
Download and view the complete annual report
Please find page 82 of the 2015 Zynga annual report below. You can navigate through the pages in the report by either clicking on the pages listed below, or by using the keyword search tool below to find specific information within the annual report.-
 1
1 -
2
-
3
-
4
-
5
-
6
-
7
-
8
-
9
-
10
-
11
-
12
-
13
-
14
-
15
-
16
-
17
-
18
-
19
-
20
-
21
-
22
-
23
-
24
-
25
-
26
-
27
-
28
-
29
-
30
-
31
-
32
-
33
-
34
-
35
-
36
-
37
-
38
-
39
-
40
-
41
-
42
-
43
-
44
-
45
-
46
-
47
-
48
-
49
-
50
-
51
-
52
-
53
-
54
-
55
-
56
-
57
-
58
-
59
-
60
-
61
-
62
-
63
-
64
-
65
-
66
-
67
-
68
-
69
-
70
-
71
-
 72
72 -
 73
73 -
 74
74 -
 75
75 -
 76
76 -
 77
77 -
 78
78 -
 79
79 -
 80
80 -
 81
81 -
 82
82 -
 83
83 -
 84
84 -
 85
85 -
 86
86 -
 87
87 -
 88
88 -
 89
89 -
 90
90 -
 91
91 -
 92
92 -
93
-
94
-
95
-
96
-
97
-
98
-
99
-
100
-
101
-
102
-
103
-
104
-
105
-
106
-
107
-
108
-
109
-
110
-
111
-
112
-
113
-
114
-
115
-
116
-
117
-
118
-
119
-
120
-
121
-
122
-
123
-
124
-
125
-
126
-
127
-
128
-
129
-
130
-
131
-
132
-
133
-
134
-
135
-
136
-
137
-
138
-
139
-
140
-
141
-
142
-
143
-
144
-
145
-
146
-
147
-
148
-
149
-
150
-
151
 |
 |
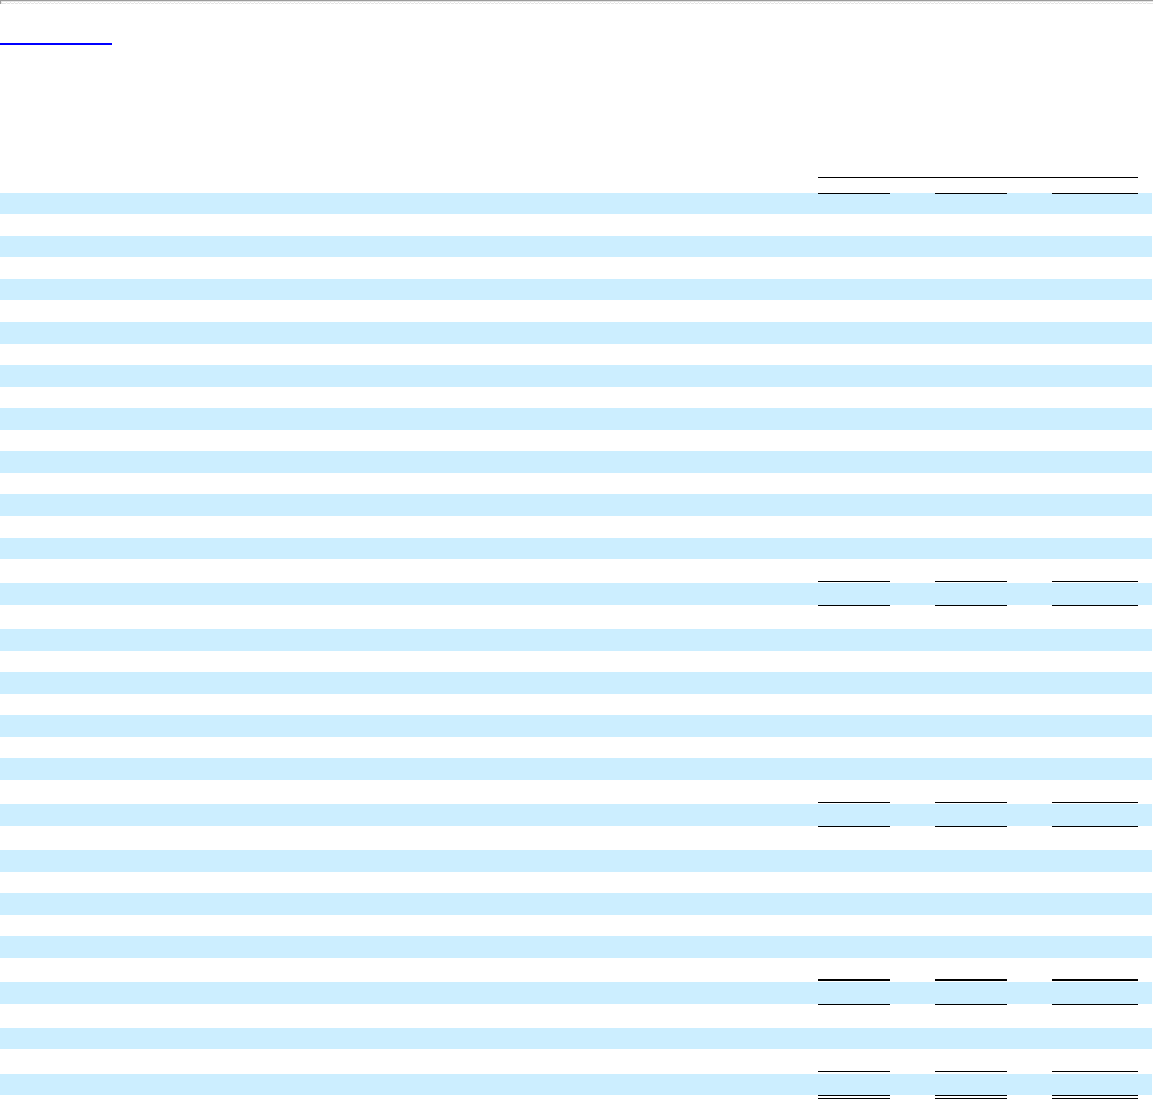
Table of Contents
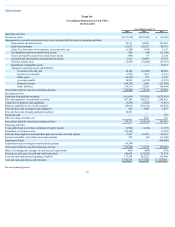
Zynga Inc.
Consolidated Statements of Cash Flows
(Inthousands)
Year Ended December 31,
2015 2014 2013
Operating activities:
Net income (loss) $(121,510) $(225,900) $ (36,982)
Adjustments to reconcile net income (loss) to net cash provided by (used in) operating activities:
Depreciation and amortization 54,315 82,894 129,047
Stock-based expense 131,575 129,233 84,393
(Gain) loss from sales of investments, assets and other, net (5,558) (1,610) 8,147
Tax benefits (costs) from stock-based awards 989 (86) (11,244)
Excess tax benefits (costs) from stock-based awards (989) 86 11,244
Accretion and amortization on marketable securities 5,711 10,061 17,575
Deferred income taxes (12,693) (10,982) (18,766)
Impairment of intangible assets — — 10,217
Changes in operating assets and liabilities:
Accounts receivable, net 10,148 (16,489) 40,806
Income tax receivable (1,929) 5,433 (1,336)
Other assets (16,167) 971 3,932
Accounts payable 10,934 (6,393) (2,325)
Deferred revenue (64,762) 3,643 (157,090)
Other liabilities (34,511) 24,628 (48,944)
Net cash provided by (used in) operating activities (44,447) (4,511) 28,674
Investing activities:
Purchases of marketable securities (101,091) (758,509) (1,074,919)
Sales and maturities of marketable securities 867,198 806,232 1,244,841
Acquisition of property and equipment (7,832) (9,201) (7,813)
Business acquisitions, net of cash acquired (20,023) (392,411) (18,054)
Proceeds from sale of property and equipment 814 5,059 3,057
Proceeds from sale of equity method investment 10,507 — —
Restricted cash — — 227
Other investing activities, net — 4,671 137
Net cash provided by (used in) investing activities 749,573 (344,159) 147,476
Financing activities:
Taxes paid related to net share settlement of equity awards (2,902) (1,216) (1,387)
Repurchases of common stock (88,409) — (9,302)
Proceeds from employee stock purchase plan and exercise of stock options 7,567 16,421 26,115
Excess tax benefits (costs) from stock-based awards 989 (86) (11,244)
Repayment of debt — — (100,000)
Acquisition-related contingent consideration payment (10,790) — —
Net cash provided by (used in) financing activities (93,545) 15,119 (95,818)
Effect of exchange rate changes on cash and cash equivalents (667) (669) (758)
Net increase (decrease) in cash and cash equivalents 610,914 (334,220) 79,574
Cash and cash equivalents, beginning of period 131,303 465,523 385,949
Cash and cash equivalents, end of period $ 742,217 $ 131,303 $ 465,523
See accompanying notes.
79