Zynga 2015 Annual Report Download - page 104
Download and view the complete annual report
Please find page 104 of the 2015 Zynga annual report below. You can navigate through the pages in the report by either clicking on the pages listed below, or by using the keyword search tool below to find specific information within the annual report.-
 1
1 -
2
-
3
-
4
-
5
-
6
-
7
-
8
-
9
-
10
-
11
-
12
-
13
-
14
-
15
-
16
-
17
-
18
-
19
-
20
-
21
-
22
-
23
-
24
-
25
-
26
-
27
-
28
-
29
-
30
-
31
-
32
-
33
-
34
-
35
-
36
-
37
-
38
-
39
-
40
-
41
-
42
-
43
-
44
-
45
-
46
-
47
-
48
-
49
-
50
-
51
-
52
-
53
-
54
-
55
-
56
-
57
-
58
-
59
-
60
-
61
-
62
-
63
-
64
-
65
-
66
-
67
-
68
-
69
-
70
-
71
-
72
-
73
-
74
-
75
-
76
-
77
-
78
-
79
-
80
-
81
-
82
-
83
-
84
-
85
-
86
-
87
-
88
-
89
-
90
-
91
-
92
-
93
-
 94
94 -
 95
95 -
 96
96 -
 97
97 -
 98
98 -
 99
99 -
 100
100 -
 101
101 -
 102
102 -
 103
103 -
 104
104 -
 105
105 -
 106
106 -
 107
107 -
 108
108 -
 109
109 -
 110
110 -
 111
111 -
 112
112 -
 113
113 -
 114
114 -
115
-
116
-
117
-
118
-
119
-
120
-
121
-
122
-
123
-
124
-
125
-
126
-
127
-
128
-
129
-
130
-
131
-
132
-
133
-
134
-
135
-
136
-
137
-
138
-
139
-
140
-
141
-
142
-
143
-
144
-
145
-
146
-
147
-
148
-
149
-
150
-
151
 |
 |
Table of Contents
common stock in the open market could result in increased volatility in our stock price. There is no guarantee that we will do any share repurchases under the
program or otherwise in the future.
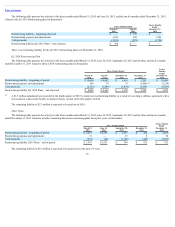
In the fourth quarter of 2015, we repurchased 37.9 million shares of our Class A common stock under the repurchase program at a weighted average price of
$2.60 per share for a total of $98.9 million. In the fourth quarter of 2015, $88.4 million of the share repurchases were recorded on the consolidated statement of
cash flow as an outflow of cash associated with financing activities. The remaining $10.5 million of share repurchases were recorded in accounts payable and other
current liabilities in the amounts of $3.5 million and $7.0 million, respectively, and will be paid in the first quarter of 2016. The program expired upon completion
of our authorized share repurchase program in February 2016.
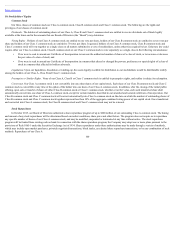
EquityIncentivePlansandStock-BasedExpense
In 2007, we adopted the 2007 Equity Incentive Plan (the “2007 Plan”) for the purpose of granting stock options and ZSUs to employees, directors and non-
employees. Concurrent with the effectiveness of our initial public offering on December 15, 2011, we adopted the 2011 Equity Incentive Plan (the “2011 Plan”),
and all remaining common shares reserved for future grant or issuance under the 2007 Plan were added to the 2011 Plan. The 2011 Plan was adopted for purposes
of granting stock options and ZSUs to employees, directors and non-employees. The number of shares of our Class A common stock reserved for future issuance
under our 2011 Plan will automatically increase on January 1 of each year, beginning on January 1, 2012, and continuing through and including January 1, 2021, by
4% of the total number of shares of our capital stock outstanding as of December 31 of the preceding calendar year.
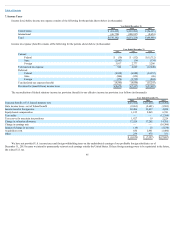
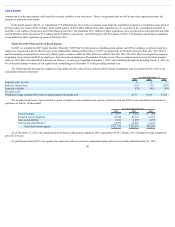
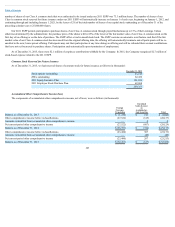
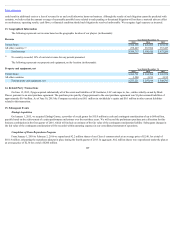
The following table presents the weighted-average grant date fair value of stock options and the related assumptions used to estimate the fair value in our
consolidated financial statements:
Year Ended December 31,
2015 2014 2013
Expected term, in years 6 5 7
Risk-free interest rates 1.65% 1.31% 2.05%
Expected volatility 53% 56% 49%
Dividend yield — — —
Weighted-average estimated fair value of options granted during the year $1.51 $3.44 $1.82
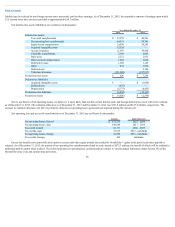
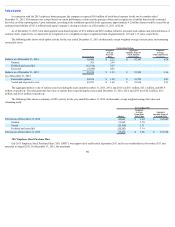
We recorded stock-based expense related to grants of employee and consultant stock options, restricted stock and ZSUs in our consolidated statements of
operations as follows (in thousands):
Year Ended December 31,
2015 2014 2013
Cost of revenue $ 4,547 $ 4,623 $ 468
Research and development 94,548 83,673 61,931
Sales and marketing 7,501 5,927 8,079
General and administrative 24,979 35,010 13,915
Total stock-based expense $131,575 $129,233 $84,393
As of December 31, 2015, total unamortized stock-based compensation relating to ZSUs amounted to $168.3 million over a weighted-average recognition
period of 2.4 years.
No performance-based ZSUs were granted in connection with our executive compensation plan in the twelve months ended December 31, 2015.
101