Zynga 2015 Annual Report Download - page 66
Download and view the complete annual report
Please find page 66 of the 2015 Zynga annual report below. You can navigate through the pages in the report by either clicking on the pages listed below, or by using the keyword search tool below to find specific information within the annual report.-
 1
1 -
2
-
3
-
4
-
5
-
6
-
7
-
8
-
9
-
10
-
11
-
12
-
13
-
14
-
15
-
16
-
17
-
18
-
19
-
20
-
21
-
22
-
23
-
24
-
25
-
26
-
27
-
28
-
29
-
30
-
31
-
32
-
33
-
34
-
35
-
36
-
37
-
38
-
39
-
40
-
41
-
42
-
43
-
44
-
45
-
46
-
47
-
48
-
49
-
50
-
51
-
52
-
53
-
54
-
55
-
 56
56 -
 57
57 -
 58
58 -
 59
59 -
 60
60 -
 61
61 -
 62
62 -
 63
63 -
 64
64 -
 65
65 -
 66
66 -
 67
67 -
 68
68 -
 69
69 -
 70
70 -
 71
71 -
 72
72 -
 73
73 -
 74
74 -
 75
75 -
 76
76 -
77
-
78
-
79
-
80
-
81
-
82
-
83
-
84
-
85
-
86
-
87
-
88
-
89
-
90
-
91
-
92
-
93
-
94
-
95
-
96
-
97
-
98
-
99
-
100
-
101
-
102
-
103
-
104
-
105
-
106
-
107
-
108
-
109
-
110
-
111
-
112
-
113
-
114
-
115
-
116
-
117
-
118
-
119
-
120
-
121
-
122
-
123
-
124
-
125
-
126
-
127
-
128
-
129
-
130
-
131
-
132
-
133
-
134
-
135
-
136
-
137
-
138
-
139
-
140
-
141
-
142
-
143
-
144
-
145
-
146
-
147
-
148
-
149
-
150
-
151
 |
 |

Table of Contents
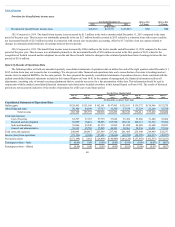
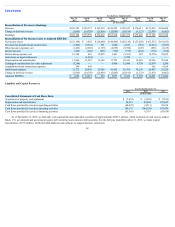
In October 2015, our board of directors authorized a $200 million stock repurchase program. We initiated purchases under this program in November 2015.
In the fourth quarter of 2015, we repurchased 37.9 million shares of our Class A common stock under this repurchase program at a weighted average price of $2.60
per share for a total of $98.9 million. The program expired upon completion of our authorized share repurchase program in February 2016.
OperatingActivities
After our net loss of $121.5 million is adjusted to exclude non-cash items, operating activities used $44.4 million of cash during the twelve months ended
December 31, 2015. Significant non-cash items included stock-based expense of $131.6 million and depreciation and amortization of $54.3 million. Stock-based
expense increased $2.3 million primarily due to an increase in grants awarded in 2015 compared to 2014. Depreciation and amortization decreased by $28.6 million
as compared to the twelve months ended December 31, 2014 primarily due to the consolidation of data facilities and the related disposition of certain data center
assets and intangible assets that were fully amortized in 2015. Net cash used in operating activities increased $39.9 million when compared to the twelve months
ended December 31, 2014. The increase in net cash used in operating activities was primarily due to changes in our operating assets and liabilities in the twelve
months ended December 31, 2015, including changes of $64.8 million and $34.5 million in deferred revenue and other liabilities, respectively, offset by changes of
$10.9 million and $10.1 million in accounts payable and accounts receivable, respectively.
After our net loss of $225.9 million is adjusted to exclude non-cash items, operating activities used $4.5 million of cash during the twelve months ended
December 31, 2014. Significant non-cash items included stock-based expense of $129.2 million and depreciation and amortization of $82.9 million. Depreciation
and amortization decreased by $46.2 million as compared to the twelve months ended December 31, 2013 as a result of fixed assets that were fully depreciated and
disposed of and intangible assets that were fully amortized in 2014. Stock-based expense increased by $44.8 million in the twelve months ended December 31,
2014 as compared to the same period of the prior year primarily due to grants related to the NaturalMotion acquisition. Net cash provided by operating activities
declined $33.2 million when compared to the twelve months ended December 31, 2013, the decline was primarily due to changes in our operating assets and
liabilities in the twelve months ended December 31, 2014, including changes of $24.6 million and $5.4 million in other liabilities and income tax receivable,
respectively, partially offset by changes of $16.5 million and $6.4 million in accounts receivable and accounts payable, respectively.
After our net loss of $37.0 million is adjusted to exclude non-cash items, operating activities provided $28.7 million of cash during the twelve months ended
December 31, 2013. Significant non-cash items included depreciation and amortization of $129.0 million, stock-based expense of $84.4 million, accretion and
amortization on marketable securities of $17.6 million and impairment of intangible assets of $10.2 million. Depreciation and amortization decreased by $12.5
million as compared to the twelve months ended December 31, 2012 as a result of fixed assets that were fully depreciated and disposed of and intangible assets that
were fully amortized or impaired in 2013. Stock-based expense decreased by $197.6 million in the twelve months ended December 31, 2013 as compared to the
same period of the prior year primarily due to increased forfeiture credits resulting from employee attrition in 2013. Net cash provided by operating activities
declined $165.0 million primarily due to changes in our operating assets and liabilities in the twelve months ended December 31, 2013, including a $157.1 million
decline in deferred revenue offset by increases in accounts receivable and other assets.
InvestingActivities
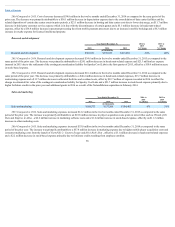
Investing activities resulted in cash inflow of $749.6 million during the twelve months ended December 31, 2015. The primary inflows of cash associated
with investing activities were $766.1 million of sales and maturities of marketable securities, net of purchases. The primary outflows of cash were $20.0 million for
the acquisition of
63