Zynga 2015 Annual Report Download - page 49
Download and view the complete annual report
Please find page 49 of the 2015 Zynga annual report below. You can navigate through the pages in the report by either clicking on the pages listed below, or by using the keyword search tool below to find specific information within the annual report.-
 1
1 -
2
-
3
-
4
-
5
-
6
-
7
-
8
-
9
-
10
-
11
-
12
-
13
-
14
-
15
-
16
-
17
-
18
-
19
-
20
-
21
-
22
-
23
-
24
-
25
-
26
-
27
-
28
-
29
-
30
-
31
-
32
-
33
-
34
-
35
-
36
-
37
-
38
-
 39
39 -
 40
40 -
 41
41 -
 42
42 -
 43
43 -
 44
44 -
 45
45 -
 46
46 -
 47
47 -
 48
48 -
 49
49 -
 50
50 -
 51
51 -
 52
52 -
 53
53 -
 54
54 -
 55
55 -
 56
56 -
 57
57 -
 58
58 -
 59
59 -
60
-
61
-
62
-
63
-
64
-
65
-
66
-
67
-
68
-
69
-
70
-
71
-
72
-
73
-
74
-
75
-
76
-
77
-
78
-
79
-
80
-
81
-
82
-
83
-
84
-
85
-
86
-
87
-
88
-
89
-
90
-
91
-
92
-
93
-
94
-
95
-
96
-
97
-
98
-
99
-
100
-
101
-
102
-
103
-
104
-
105
-
106
-
107
-
108
-
109
-
110
-
111
-
112
-
113
-
114
-
115
-
116
-
117
-
118
-
119
-
120
-
121
-
122
-
123
-
124
-
125
-
126
-
127
-
128
-
129
-
130
-
131
-
132
-
133
-
134
-
135
-
136
-
137
-
138
-
139
-
140
-
141
-
142
-
143
-
144
-
145
-
146
-
147
-
148
-
149
-
150
-
151
 |
 |

Table of Contents
deferred and recognized over the estimated average life of the branded virtual good, similar to online game revenue. For additional discussion of the estimated
average life of durable virtual goods, see the section titled “Management’s Discussion and Analysis of Financial Condition and Results of Operations—Revenue
Recognition” elsewhere in this Annual Report on Form 10-K.
We use bookings to evaluate the results of our operations, generate future operating plans and assess the performance of our company. While we believe that
this non-GAAP financial measure is useful in evaluating our business, this information should be considered as supplemental in nature and is not meant as a
substitute for revenue recognized in accordance with GAAP. In addition, other companies, including companies in our industry, may calculate bookings differently
or not at all, which reduces its usefulness as a comparative measure.
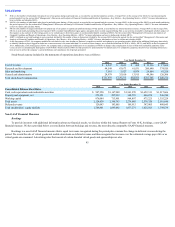
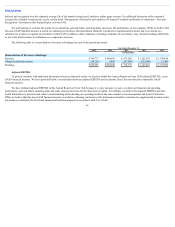
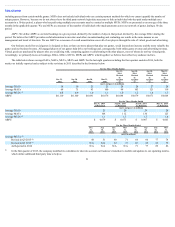
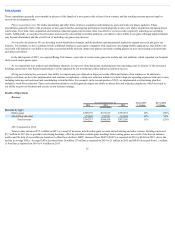
The following table is a reconciliation of revenue to bookings for each of the periods presented:
Year Ended December 31,
2015 2014 2013 2012 2011
(in thousands)
Reconciliation of Revenue to Bookings:
Revenue $ 764,717 $ 690,410 $ 873,266 $ 1,281,267 $ 1,140,100
Change in deferred revenue (64,762) 3,890 (157,090) (133,640) 15,409
Bookings $ 699,955 $ 694,300 $ 716,176 $ 1,147,627 $ 1,155,509
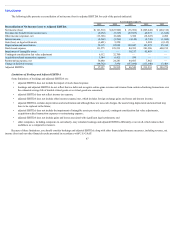
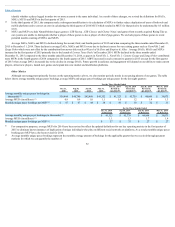
AdjustedEBITDA
To provide investors with additional information about our financial results, we disclose within this Annual Report on Form 10-K adjusted EBITDA, a non-
GAAP financial measure. We have provided below a reconciliation between adjusted EBITDA and net income (loss), the most directly comparable GAAP
financial measure.
We have included adjusted EBITDA in this Annual Report on Form 10-K because it is a key measure we use to evaluate our financial and operating
performance, generate future operating plans and make strategic decisions for the allocation of capital. Accordingly, we believe that adjusted EBITDA provides
useful information to investors and others in understanding and evaluating our operating results in the same manner as our management and board of directors.
While we believe that this non-GAAP financial measure is useful in evaluating our business, this information should be considered as supplemental in nature and is
not meant as a substitute for the related financial information prepared in accordance with U.S. GAAP.
46