Zynga 2015 Annual Report Download - page 65
Download and view the complete annual report
Please find page 65 of the 2015 Zynga annual report below. You can navigate through the pages in the report by either clicking on the pages listed below, or by using the keyword search tool below to find specific information within the annual report.-
 1
1 -
2
-
3
-
4
-
5
-
6
-
7
-
8
-
9
-
10
-
11
-
12
-
13
-
14
-
15
-
16
-
17
-
18
-
19
-
20
-
21
-
22
-
23
-
24
-
25
-
26
-
27
-
28
-
29
-
30
-
31
-
32
-
33
-
34
-
35
-
36
-
37
-
38
-
39
-
40
-
41
-
42
-
43
-
44
-
45
-
46
-
47
-
48
-
49
-
50
-
51
-
52
-
53
-
54
-
 55
55 -
 56
56 -
 57
57 -
 58
58 -
 59
59 -
 60
60 -
 61
61 -
 62
62 -
 63
63 -
 64
64 -
 65
65 -
 66
66 -
 67
67 -
 68
68 -
 69
69 -
 70
70 -
 71
71 -
 72
72 -
 73
73 -
 74
74 -
 75
75 -
76
-
77
-
78
-
79
-
80
-
81
-
82
-
83
-
84
-
85
-
86
-
87
-
88
-
89
-
90
-
91
-
92
-
93
-
94
-
95
-
96
-
97
-
98
-
99
-
100
-
101
-
102
-
103
-
104
-
105
-
106
-
107
-
108
-
109
-
110
-
111
-
112
-
113
-
114
-
115
-
116
-
117
-
118
-
119
-
120
-
121
-
122
-
123
-
124
-
125
-
126
-
127
-
128
-
129
-
130
-
131
-
132
-
133
-
134
-
135
-
136
-
137
-
138
-
139
-
140
-
141
-
142
-
143
-
144
-
145
-
146
-
147
-
148
-
149
-
150
-
151
 |
 |
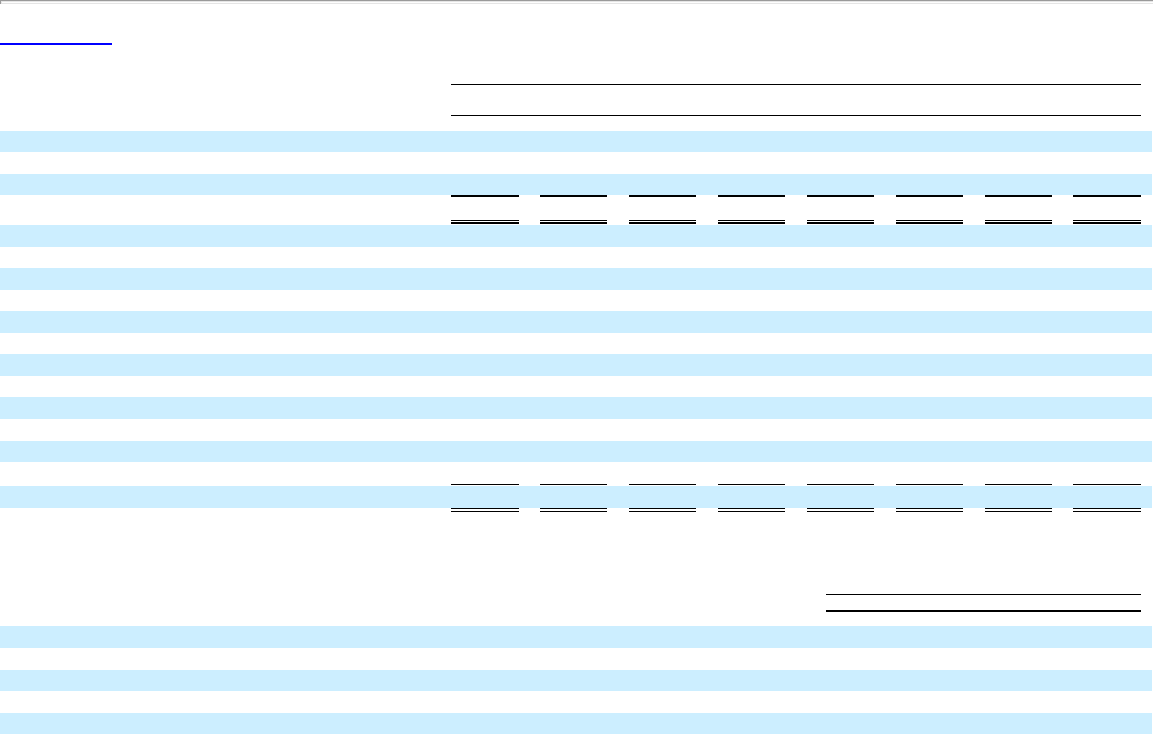
Table of Contents
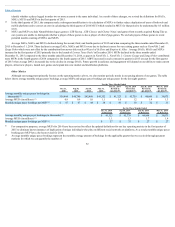
For the Three Months Ended
Dec 31,
2015
Sep 30,
2015
Jun 30,
2015
Mar 31,
2015
Dec 31,
2014
Sep 30,
2014
Jun 30,
2014
Mar 31,
2014
(in thousands)
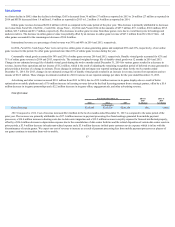
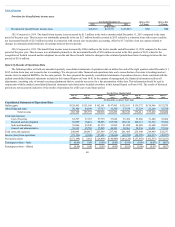
Reconciliation of Revenue to Bookings:
Revenue $185,769 $ 195,737 $199,918 $183,293 $192,547 $176,611 $ 153,232 $168,020
Change in deferred revenue (3,665) (19,758) (25,456) (15,883) (10,195) (1,123) 21,870 (6,662)
Bookings $182,104 $ 175,979 $174,462 $167,410 $182,352 $175,488 $ 175,102 $161,358
Reconciliation of Net Income (Loss) to Adjusted EBITDA:
Net income (loss) $ (51,198) $ 3,052 $ (26,868) $ (46,496) $ (45,126) $ (57,058) $ (62,533) $ (61,183)
Provision for (benefit from) income taxes (1,862) (9,381) 991 1,580 2,547 (783) (2,012) (7,079)
Other income (expense), net (1,463) (2,285) (1,199) (8,359) (5,580) (647) (896) (1,125)
Interest income (603) (566) (605) (794) (779) (841) (776) (870)
Restructuring expense, net 19,748 416 12,855 3,461 (3,391) 287 (2,270) 29,655
Gain (loss) on legal settlements — (1,681) — — 5,250 — — —
Depreciation and amortization 11,966 11,287 13,340 17,722 18,341 19,283 19,926 25,344
Contingent consideration fair value adjustment (3,288) — — 9,400 12,600 6,750 12,070 1,280
Acquisition-related transaction expenses 249 895 — — — — 265 6,160
Stock-based expense 31,772 30,436 27,905 41,462 35,765 36,295 28,847 28,326
Change in deferred revenue (3,665) (19,758) (25,456) (15,883) (10,195) (1,123) 21,870 (6,662)
Adjusted EBITDA $ 1,656 $ 12,415 $ 963 $ 2,093 $ 9,432 $ 2,163 $ 14,491 $ 13,846
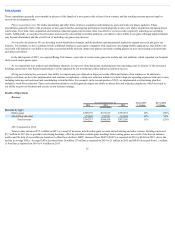
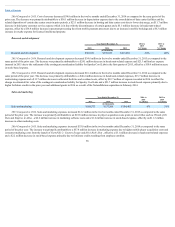
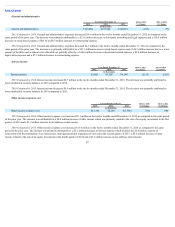
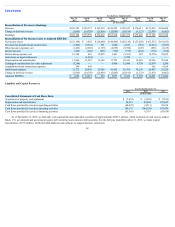
Liquidity and Capital Resources
Year Ended December 31,
2015 2014 2013
(in thousands)
Consolidated Statements of Cash Flows Data:
Acquisition of property and equipment $ (7,832) $ (9,201) $ (7,813)
Depreciation and amortization 54,315 82,894 129,047
Cash flows provided by (used in) operating activities (44,447) (4,511) 28,674
Cash flows provided by (used in) investing activities 749,573 (344,159) 147,476
Cash flows provided by (used in) financing activities (93,545) 15,119 (95,818)
As of December 31, 2015, we had cash, cash equivalents and marketable securities of approximately $987.3 million, which consisted of cash, money market
funds, U.S. government and government agency debt securities and corporate debt securities. For the full year ended December 31, 2015, we made capital
expenditures of $7.8 million, which included hardware and software to support business operations.
62