Zynga 2015 Annual Report Download - page 63
Download and view the complete annual report
Please find page 63 of the 2015 Zynga annual report below. You can navigate through the pages in the report by either clicking on the pages listed below, or by using the keyword search tool below to find specific information within the annual report.
Table of Contents
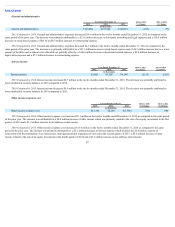
Provisionfor(benefitfrom)incometaxes
Year Ended December 31, 2014 to 2015
% Change
2013 to 2014
% Change 2015 2014 2013
(in thousands)
Provision for (benefit from) income taxes $(8,672) $(7,327) $ (27,887) NM NM
2015 Compared to 2014. The benefit from income taxes increased by $1.3 million in the twelve months ended December 31, 2015 compared to the same
period of the prior year. This increase was attributable primarily to the net $2.7 million benefit recorded in 2015 related to a reduction in tax risk reserves and the
net incremental benefit of $2.5 million recorded in connection with current year tax purchase accounting, offset by $3.7 million of net tax expense related to
changes in estimated jurisdictional mix of earnings between the two periods.
2014 Compared to 2013. The benefit from income taxes decreased by $20.6 million in the twelve months ended December 31, 2014 compared to the same
period of the prior year. This decrease was attributable primarily to the incremental benefit of $5.0 million recorded in the first quarter of 2013 related to the
recognition of Federal research and development tax credits and the net benefit related to changes in the estimated jurisdictional mix of earnings between the two
periods of $15.6 million.
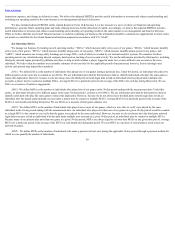
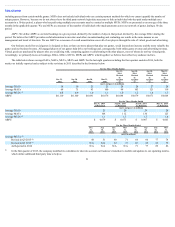
Quarterly Results of Operations Data
The following tables set forth our unaudited quarterly consolidated statements of operations data in dollars for each of the eight quarters ended December 31,
2015 (certain items may not reconcile due to rounding). We also present other financial and operations data, and a reconciliation of revenue to bookings and net
income (loss) to adjusted EBITDA, for the same periods. We have prepared the quarterly consolidated statements of operations data on a basis consistent with the
audited consolidated financial statements included in this Annual Report on Form 10-K. In the opinion of management, the financial information reflects all
adjustments, consisting only of normal recurring adjustments that we consider necessary for a fair presentation of this data. This information should be read in
conjunction with the audited consolidated financial statements and related notes included elsewhere in this Annual Report on Form 10-K. The results of historical
periods are not necessarily indicative of the results of operations for a full year or any future period.
For the Three Months Ended
Dec 31, Sep 30, Jun 30, Mar 31, Dec 31, Sep 30, Jun 30, Mar 31,
2015 2015 2015 2015 2014 2014 2014 2014
(in thousands, except per share data)
Consolidated Statements of Operations Data:
Online game $129,463 $ 151,168 $162,161 $147,963 $135,011 $139,372 $ 130,966 $132,270
Advertising and other 56,306 44,569 37,757 35,330 57,536 37,239 22,266 35,750
Total revenue 185,769 195,737 199,918 183,293 192,547 176,611 153,232 168,020
Costs and expenses:
Cost of revenue 63,397 57,187 57,779 57,622 55,492 53,286 51,288 53,504
Research and development 85,099 78,416 90,896 107,520 105,134 100,113 93,722 97,584
Sales and marketing 53,066 43,549 41,119 31,839 41,898 44,005 41,608 29,853
General and administrative 39,333 25,765 37,805 40,381 38,961 38,536 32,831 57,336
Total costs and expenses 240,895 204,917 227,599 237,362 241,485 235,940 219,449 238,277
Income (loss) from operations (55,126) (9,180) (27,681) (54,069) (48,938) (59,329) (66,217) (70,257)
Net income (loss) $ (51,198) $ 3,052 $ (26,868) $ (46,496) $ (45,126) $ (57,058) $ (62,533) $ (61,183)
Earnings per share—basic $ (0.06) $ 0.00 $ (0.03) $ (0.05) $ (0.05) $ (0.06) $ (0.07) $ (0.07)
Earnings per share—diluted $ (0.06) $ 0.00 $ (0.03) $ (0.05) $ (0.05) $ (0.06) $ (0.07) $ (0.07)
60


