Zynga 2015 Annual Report Download - page 59
Download and view the complete annual report
Please find page 59 of the 2015 Zynga annual report below. You can navigate through the pages in the report by either clicking on the pages listed below, or by using the keyword search tool below to find specific information within the annual report.-
 1
1 -
2
-
3
-
4
-
5
-
6
-
7
-
8
-
9
-
10
-
11
-
12
-
13
-
14
-
15
-
16
-
17
-
18
-
19
-
20
-
21
-
22
-
23
-
24
-
25
-
26
-
27
-
28
-
29
-
30
-
31
-
32
-
33
-
34
-
35
-
36
-
37
-
38
-
39
-
40
-
41
-
42
-
43
-
44
-
45
-
46
-
47
-
48
-
 49
49 -
 50
50 -
 51
51 -
 52
52 -
 53
53 -
 54
54 -
 55
55 -
 56
56 -
 57
57 -
 58
58 -
 59
59 -
 60
60 -
 61
61 -
 62
62 -
 63
63 -
 64
64 -
 65
65 -
 66
66 -
 67
67 -
 68
68 -
 69
69 -
70
-
71
-
72
-
73
-
74
-
75
-
76
-
77
-
78
-
79
-
80
-
81
-
82
-
83
-
84
-
85
-
86
-
87
-
88
-
89
-
90
-
91
-
92
-
93
-
94
-
95
-
96
-
97
-
98
-
99
-
100
-
101
-
102
-
103
-
104
-
105
-
106
-
107
-
108
-
109
-
110
-
111
-
112
-
113
-
114
-
115
-
116
-
117
-
118
-
119
-
120
-
121
-
122
-
123
-
124
-
125
-
126
-
127
-
128
-
129
-
130
-
131
-
132
-
133
-
134
-
135
-
136
-
137
-
138
-
139
-
140
-
141
-
142
-
143
-
144
-
145
-
146
-
147
-
148
-
149
-
150
-
151
 |
 |

Table of Contents
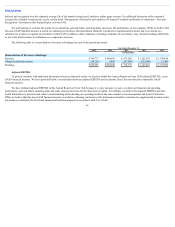
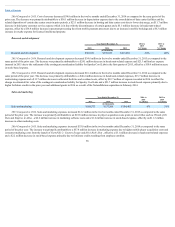
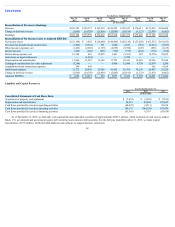
Online game revenue increased $53.1 million in 2015 as compared to the same period of the prior year. This increase is primarily attributable to increases in
online game revenue from FarmVille 2: Country Escape , Wizard of Oz Slots and Hit It Rich! Slots , in the amounts of $60.6 million, $58.3 million and $44.6
million, respectively. Online game revenue increased for FarmVille 2: Country Escape and Wizard of Oz Slots as these games were launched in April 2014 and
November 2014, respectively, while online game revenue increased for Hit It Rich! Slots as the game did not launch on all platforms and devices until May 2014.
The increase in online game revenue was partially offset by decreases in online game revenue from FarmVille 2 , FarmVille and Zynga Poker (web) in the amounts
of $38.2 million, $19.2 million and $17.3 million, respectively, due to the overall decay rate in bookings and audience metrics in these games. Moreover, there was
a $14.9 million decrease in online game revenue for Ayakashi as this game was discontinued in the second quarter of 2015. All other games accounted for the
remaining net decrease of $20.8 million.
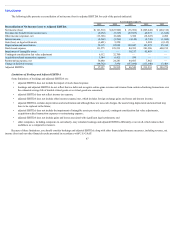
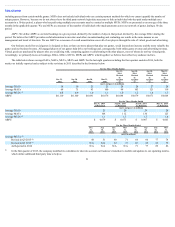
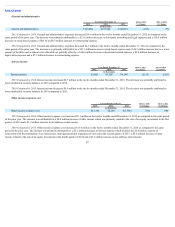
International revenue as a percentage of total revenue was 34% and 38% in 2015 and 2014, respectively.
In 2015, FarmVille 2, Zynga Poker , Hit It Rich! Slots , FarmVille 2: Country Escape and Wizard of Oz Slots were our top online game revenue-generating
games and comprised 19%, 18%, 16%, 14% and 10%, respectively, of our online game revenue for the period. No other game generated more than 10% of online
game revenue during the year.
Consumable virtual goods accounted for 46% and 38% of online game revenue in 2015 and 2014, respectively. Durable virtual goods accounted for 54% and
62% of online game revenue in 2015 and 2014, respectively. The estimated weighted-average life of durable virtual goods was 10 months in 2015 and 12 months in
2014. Changes in our estimated average life of durable virtual goods during the twelve months ended December 31, 2015 for various games resulted in an increase
in revenue, income from operations and net income of $1.0 million, which is the result of adjusting the remaining recognition period of deferred revenue generated
in prior periods at the time of a change in estimate. We also recognized $9.9 million of revenue and income from operations in the twelve months ended
December 31, 2015 due to changes in our estimated average life of durable goods for games that were discontinued as there is no further service obligation after the
closure of these games. These changes in estimates and discontinuance of games resulted in a $0.01 per share impact on our reported earnings per share for the
twelve months ended December 31, 2015. For 2014, changes in our estimated average life of durable virtual goods resulted in a decrease in revenue, income from
operations and net income of $1.2 million. These changes in estimates did not impact our reported earnings per share for the twelve months ended December 31,
2014.
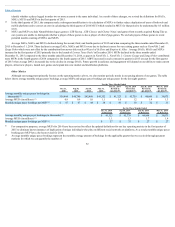
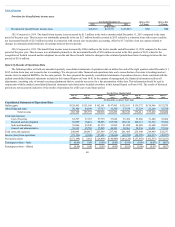
Advertising and other revenue increased $21.2 million from the twelve months ended December 31, 2014 to the twelve months ended December 31, 2015
primarily due to a $27.4 million increase in in-game display ads as a result of better optimization and performance on mobile platforms. The increase was also
attributed to an $8.3 million increase in in-game offers, engagement ads and other advertising revenue which was primarily due to an increase in engagement ads
on our mobile games. The increases in in-game display ads and engagement ads were driven by the Company’s transition from web to mobile, as mobile bookings
as a percentage of total bookings grew from 51% in 2014 to 68% in 2015 and mobile revenue as a percentage of total revenue grew from 44% in 2014 to 64% in
2015. These increases were offset by a $12.1 million decrease in licensing revenue driven by the final licensing payment from a strategic partner in 2014 and a $2.4
million decrease in in-game sponsorships, which were historically more prevalent in our web games, such as CityVille and FarmVille .
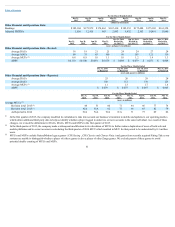
2014 Compared to 2013.
Total revenue decreased $182.9 million in 2014 as a result of a decline in online game revenue offset by an increase in advertising and other revenue.
Bookings decreased by $21.9 million from 2013 to 2014 due to declines in existing games, declines in audience metrics and the lack of successful new launches to
offset these declines. ABPU increased from $0.054 ($0.053 as reported) in 2013 to $0.074 ($0.071 as reported) in 2014, due
56