Zynga 2015 Annual Report Download - page 64
Download and view the complete annual report
Please find page 64 of the 2015 Zynga annual report below. You can navigate through the pages in the report by either clicking on the pages listed below, or by using the keyword search tool below to find specific information within the annual report.-
 1
1 -
2
-
3
-
4
-
5
-
6
-
7
-
8
-
9
-
10
-
11
-
12
-
13
-
14
-
15
-
16
-
17
-
18
-
19
-
20
-
21
-
22
-
23
-
24
-
25
-
26
-
27
-
28
-
29
-
30
-
31
-
32
-
33
-
34
-
35
-
36
-
37
-
38
-
39
-
40
-
41
-
42
-
43
-
44
-
45
-
46
-
47
-
48
-
49
-
50
-
51
-
52
-
53
-
 54
54 -
 55
55 -
 56
56 -
 57
57 -
 58
58 -
 59
59 -
 60
60 -
 61
61 -
 62
62 -
 63
63 -
 64
64 -
 65
65 -
 66
66 -
 67
67 -
 68
68 -
 69
69 -
 70
70 -
 71
71 -
 72
72 -
 73
73 -
 74
74 -
75
-
76
-
77
-
78
-
79
-
80
-
81
-
82
-
83
-
84
-
85
-
86
-
87
-
88
-
89
-
90
-
91
-
92
-
93
-
94
-
95
-
96
-
97
-
98
-
99
-
100
-
101
-
102
-
103
-
104
-
105
-
106
-
107
-
108
-
109
-
110
-
111
-
112
-
113
-
114
-
115
-
116
-
117
-
118
-
119
-
120
-
121
-
122
-
123
-
124
-
125
-
126
-
127
-
128
-
129
-
130
-
131
-
132
-
133
-
134
-
135
-
136
-
137
-
138
-
139
-
140
-
141
-
142
-
143
-
144
-
145
-
146
-
147
-
148
-
149
-
150
-
151
 |
 |

Table of Contents
For the Three Months Ended
Dec 31,
2015
Sep 30,
2015
Jun 30,
2015
Mar 31,
2015
Dec 31,
2014
Sep 30,
2014
Jun 30,
2014
Mar 31,
2014
(dollars in thousands)
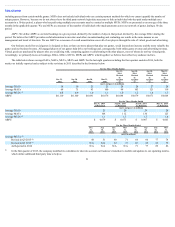
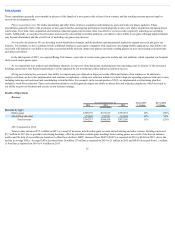
Other Financial and Operations Data:
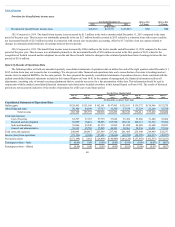
Bookings $182,104 $175,979 $174,462 $167,410 $ 182,352 $175,488 $175,102 $161,358
Adjusted EBITDA 1,656 12,415 963 2,093 9,432 2,163 14,491 13,846
For the Three Months Ended
Dec 31,
2015
Sep 30,
2015
Jun 30,
2015
Mar 31,
2015
Dec 31, 2014
Revised in
Q1 2015
Sep 30, 2014
Revised in
Q1 2015
Jun 30, 2014
Revised in
Q1 2015
Mar 31, 2014
Revised in
Q1 2015
(users and payers in millions)
Other Financial and Operations Data—Revised:
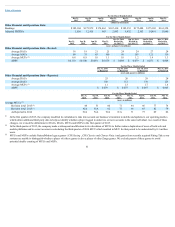
Average DAUs 18 19 21 25 24 24 27 28
Average MAUs 68 75 83 100 98 103 121 119
Average MUPs 0.8 0.9 1.0 1.1 1.0 1.2 1.4 1.3
ABPU $0.110 $0.100 $0.091 $0.076 $ 0.084 $ 0.079 $ 0.071 $ 0.064
For the Three Months Ended
Dec 31, 2014
As Reported
Sep 30, 2014
As Reported
Jun 30, 2014
As Reported
Mar 31, 2014
As Reported
(users and payers in millions)
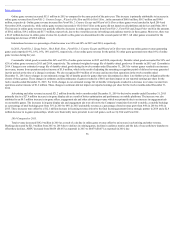
Other Financial and Operations Data—Reported:
Average DAUs 25 26 29 28
Average DAUs 108 112 130 123
Average MUPs 1.1 1.3 1.7 1.4
ABPU $ 0.079 $ 0.073 $ 0.067 $ 0.063
For the Three Months Ended
Dec 31,
2015
Sep 30,
2015
Jun 30,
2015
Mar 31,
2015
Dec 31,
2014
Sep 30,
2014
Jun 30,
2014
Mar 31,
2014
(users in millions)
Average MUUs
Revision in Q3 2015 48 51 60 71 64 66 77 74
Revision in Q1 2015 N/A N/A 62 73 66 65 82 79
As Reported in 2014 N/A N/A N/A N/A 71 77 89 86
In the first quarter of 2015, the company modified its calculation to take into account our business’s transition to mobile and updates to our operating metrics
which utilize additional third party data to help us identify whether a player logged in under two or more accounts is the same individual. As a result of these
changes, we revised the definitions for DAUs, MAUs, MUUs and MUPs in the first quarter of 2015.
In the third quarter of 2015, the company made a subsequent modification to its calculation of MUUs to further reduce duplication of users of both web and
mobile platforms and to correct an error in calculating the third quarter of 2014 MUU which resulted in MUU for that period to be understated by 0.3 million
users.
MUUs and MUPs exclude NaturalMotion legacy games ( CSR Racing , CSR Classics and Clumsy Ninja ) and games from recently acquired Rising Tide as our
systems are unable to distinguish whether a player of a these games is also a player of other Zynga games. We exclude payers of these games to avoid
potential double counting of MUUs and MUPs.
61
(1) (1) (1) (1)
(3)
(3)
(3)
(2)
(1)
(1)
(2)
(3)