Zynga 2015 Annual Report Download - page 79
Download and view the complete annual report
Please find page 79 of the 2015 Zynga annual report below. You can navigate through the pages in the report by either clicking on the pages listed below, or by using the keyword search tool below to find specific information within the annual report.-
 1
1 -
2
-
3
-
4
-
5
-
6
-
7
-
8
-
9
-
10
-
11
-
12
-
13
-
14
-
15
-
16
-
17
-
18
-
19
-
20
-
21
-
22
-
23
-
24
-
25
-
26
-
27
-
28
-
29
-
30
-
31
-
32
-
33
-
34
-
35
-
36
-
37
-
38
-
39
-
40
-
41
-
42
-
43
-
44
-
45
-
46
-
47
-
48
-
49
-
50
-
51
-
52
-
53
-
54
-
55
-
56
-
57
-
58
-
59
-
60
-
61
-
62
-
63
-
64
-
65
-
66
-
67
-
68
-
 69
69 -
 70
70 -
 71
71 -
 72
72 -
 73
73 -
 74
74 -
 75
75 -
 76
76 -
 77
77 -
 78
78 -
 79
79 -
 80
80 -
 81
81 -
 82
82 -
 83
83 -
 84
84 -
 85
85 -
 86
86 -
 87
87 -
 88
88 -
 89
89 -
90
-
91
-
92
-
93
-
94
-
95
-
96
-
97
-
98
-
99
-
100
-
101
-
102
-
103
-
104
-
105
-
106
-
107
-
108
-
109
-
110
-
111
-
112
-
113
-
114
-
115
-
116
-
117
-
118
-
119
-
120
-
121
-
122
-
123
-
124
-
125
-
126
-
127
-
128
-
129
-
130
-
131
-
132
-
133
-
134
-
135
-
136
-
137
-
138
-
139
-
140
-
141
-
142
-
143
-
144
-
145
-
146
-
147
-
148
-
149
-
150
-
151
 |
 |

Table of Contents
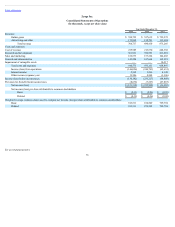
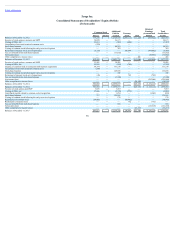
Zynga Inc.
Consolidated Statements of Operations
(Inthousands,exceptpersharedata)
Year Ended December 31,
2015 2014 2013
Revenue:
Online game $ 590,755 $ 537,619 $ 759,572
Advertising and other 173,962 152,791 113,694
Total revenue 764,717 690,410 873,266
Costs and expenses:
Cost of revenue 235,985 213,570 248,358
Research and development 361,931 396,553 413,001
Sales and marketing 169,573 157,364 104,403
General and administrative 143,284 167,664 162,918
Impairment of intangible assets — — 10,217
Total costs and expenses 910,773 935,151 938,897
Income (loss) from operations (146,056) (244,741) (65,631)
Interest income 2,568 3,266 4,148
Other income (expense), net 13,306 8,248 (3,386)
Income (loss) before income taxes (130,182) (233,227) (64,869)
Provision for (benefit from) income taxes (8,672) (7,327) (27,887)
Net income (loss) $ (121,510) $ (225,900) $ (36,982)
Net income (loss) per share attributable to common stockholders
Basic $ (0.13) $ (0.26) $ (0.05)
Diluted $ (0.13) $ (0.26) $ (0.05)
Weighted average common shares used to compute net income (loss)per share attributable to common stockholders:
Basic 913,511 874,509 799,794
Diluted 913,511 874,509 799,794
See accompanying notes.
76