Zynga 2015 Annual Report Download - page 58
Download and view the complete annual report
Please find page 58 of the 2015 Zynga annual report below. You can navigate through the pages in the report by either clicking on the pages listed below, or by using the keyword search tool below to find specific information within the annual report.-
 1
1 -
2
-
3
-
4
-
5
-
6
-
7
-
8
-
9
-
10
-
11
-
12
-
13
-
14
-
15
-
16
-
17
-
18
-
19
-
20
-
21
-
22
-
23
-
24
-
25
-
26
-
27
-
28
-
29
-
30
-
31
-
32
-
33
-
34
-
35
-
36
-
37
-
38
-
39
-
40
-
41
-
42
-
43
-
44
-
45
-
46
-
47
-
 48
48 -
 49
49 -
 50
50 -
 51
51 -
 52
52 -
 53
53 -
 54
54 -
 55
55 -
 56
56 -
 57
57 -
 58
58 -
 59
59 -
 60
60 -
 61
61 -
 62
62 -
 63
63 -
 64
64 -
 65
65 -
 66
66 -
 67
67 -
 68
68 -
69
-
70
-
71
-
72
-
73
-
74
-
75
-
76
-
77
-
78
-
79
-
80
-
81
-
82
-
83
-
84
-
85
-
86
-
87
-
88
-
89
-
90
-
91
-
92
-
93
-
94
-
95
-
96
-
97
-
98
-
99
-
100
-
101
-
102
-
103
-
104
-
105
-
106
-
107
-
108
-
109
-
110
-
111
-
112
-
113
-
114
-
115
-
116
-
117
-
118
-
119
-
120
-
121
-
122
-
123
-
124
-
125
-
126
-
127
-
128
-
129
-
130
-
131
-
132
-
133
-
134
-
135
-
136
-
137
-
138
-
139
-
140
-
141
-
142
-
143
-
144
-
145
-
146
-
147
-
148
-
149
-
150
-
151
 |
 |

Table of Contents
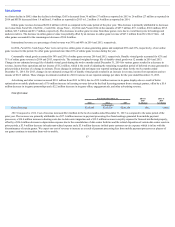
These expenditures generally occur months in advance of the launch of a new game or the release of new content, and the resulting revenue may not equal or
exceed our development costs.
Player acquisition costs. We utilize advertising and other forms of player acquisition and retention to grow and retain our player audience. These
expenditures generally relate to the promotion of new game launches and ongoing performance-based programs to drive new player acquisition and lapsed player
reactivation. Over time, these acquisition and retention-related programs may become either less effective or more costly, negatively impacting our operating
results. Additionally, as our player base becomes more heavily concentrated on mobile platforms, our ability to drive traffic to our games through unpaid channels
may become diminished, and the overall cost of marketing our games may increase.
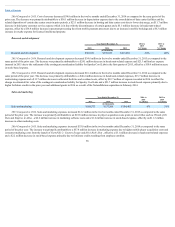
New market development. We are investing in new distribution channels, mobile platforms and international markets to expand our reach and grow our
business. For example, we have continued to hire additional employees and acquire companies with experience developing mobile applications. Our ability to be
successful will depend on our ability to develop a successful mobile network, obtain new players and retain existing players on new and existing social networks
and attract advertisers.
In the third quarter of 2015, we acquired Rising Tide Games, a provider of social casino games for mobile and web platforms which expanded our footprint
in the social casino games space.
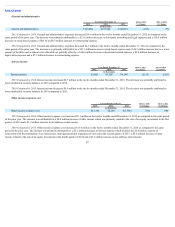
As we expand into new markets and distribution channels, we expect to incur headcount, marketing and other operating costs in advance of the associated
bookings and revenue. Our financial performance will be impacted by our investment in these initiatives and their success.
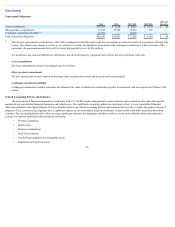
Hiring and retaining key personnel. Our ability to compete and grow depends in large part on the efforts and talents of our employees. In addition to
employee attrition, we have also implemented, and continue to implement, certain cost reduction initiatives to better align our operating expenses with our revenue,
including reducing our headcount and consolidating certain facilities. For example, in the second quarter of 2015, we implemented a restructuring plan that
included a work force reduction. These cost reduction initiatives could negatively impact our ability to attract, hire and retain key employees, which is critical to
our ability to grow our business and execute on our business strategy.
Results of Operations
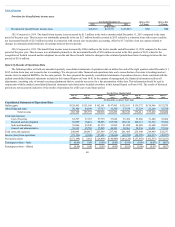
Revenue
Year Ended December 31, 2014 to 2015
% Change
2013 to 2014
% Change 2015 2014 2013
(in thousands)
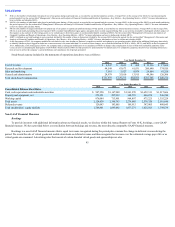
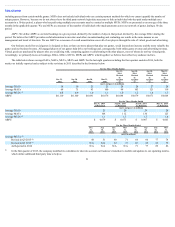
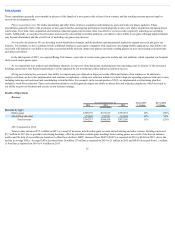
Revenue by type:
Online game $590,755 $537,619 $759,572 10% (29)%
Advertising and other 173,962 152,791 113,694 14% 34%
Total revenue $764,717 $690,410 $873,266 11% (21)%
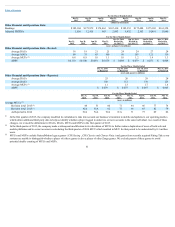
2015 Compared to 2014.
Total revenue increased $74.3 million in 2015 as a result of increases in both online game revenue and advertising and other revenue. Bookings increased
$5.7 million in 2015 due to growth in advertising bookings, offset by a decline in online game bookings from existing games as a result of declines in audience
metrics and the lack of successful new launches to offset these declines. ABPU increased from $0.074 ($0.071 as reported) in 2014 to $0.093 in 2015, due to the
decline in average DAUs. Average DAUs decreased from 26 million (27 million as reported) in 2014 to 21 million in 2015 and MUPs decreased from 1.2 million
(1.4 million as reported) in 2014 to 0.9 million in 2015.
55