Zynga 2015 Annual Report Download - page 54
Download and view the complete annual report
Please find page 54 of the 2015 Zynga annual report below. You can navigate through the pages in the report by either clicking on the pages listed below, or by using the keyword search tool below to find specific information within the annual report.-
 1
1 -
2
-
3
-
4
-
5
-
6
-
7
-
8
-
9
-
10
-
11
-
12
-
13
-
14
-
15
-
16
-
17
-
18
-
19
-
20
-
21
-
22
-
23
-
24
-
25
-
26
-
27
-
28
-
29
-
30
-
31
-
32
-
33
-
34
-
35
-
36
-
37
-
38
-
39
-
40
-
41
-
42
-
43
-
 44
44 -
 45
45 -
 46
46 -
 47
47 -
 48
48 -
 49
49 -
 50
50 -
 51
51 -
 52
52 -
 53
53 -
 54
54 -
 55
55 -
 56
56 -
 57
57 -
 58
58 -
 59
59 -
 60
60 -
 61
61 -
 62
62 -
 63
63 -
 64
64 -
65
-
66
-
67
-
68
-
69
-
70
-
71
-
72
-
73
-
74
-
75
-
76
-
77
-
78
-
79
-
80
-
81
-
82
-
83
-
84
-
85
-
86
-
87
-
88
-
89
-
90
-
91
-
92
-
93
-
94
-
95
-
96
-
97
-
98
-
99
-
100
-
101
-
102
-
103
-
104
-
105
-
106
-
107
-
108
-
109
-
110
-
111
-
112
-
113
-
114
-
115
-
116
-
117
-
118
-
119
-
120
-
121
-
122
-
123
-
124
-
125
-
126
-
127
-
128
-
129
-
130
-
131
-
132
-
133
-
134
-
135
-
136
-
137
-
138
-
139
-
140
-
141
-
142
-
143
-
144
-
145
-
146
-
147
-
148
-
149
-
150
-
151
 |
 |

Table of Contents
including payers from certain mobile games. MUPs does not include individuals who use certain payment methods for which we cannot quantify the number of
unique payers. However, because we do not always have the third party network login data necessary to link an individual who has paid under multiple user
accounts in a 30-day period, a player who has paid using multiple user accounts may be counted as multiple MUPs. MUPs are presented as an average of the three
months in the applicable quarter. We use MUPs as a measure of the number of individuals who made payments across our network of games during a 30-day
period.
ABPU. We define ABPU as our total bookings in a given period, divided by the number of days in that period, divided by, the average DAUs during the
period. We believe that ABPU provides useful information to investors and others in understanding and evaluating our results in the same manner as our
management and board of directors. We use ABPU as a measure of overall monetization across all of our players through the sale of virtual goods and advertising.
Our business model for social games is designed so that, as there are more players that play our games, social interactions increase and the more valuable the
games and our business become. All engaged players of our games help drive our bookings and, consequently, both online game revenue and advertising revenue.
Virtual goods are purchased by players who are socializing with, competing against or collaborating with other players, most of whom do not buy virtual goods.
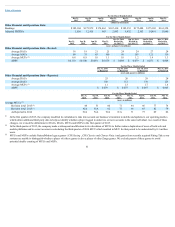
Accordingly, we primarily focus on bookings, DAUs, MAUs, MUUs, MUPs and ABPU, which together we believe best reflect key audience metrics.
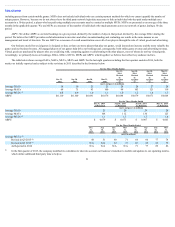
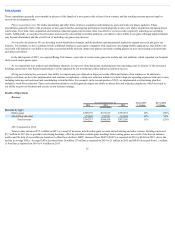
The table below shows average DAUs, MAUs, MUUs, MUPs and ABPU for the last eight quarters including the four quarters ended in 2014, both the
metrics as initially reported and as subject to the revisions in 2015 described in the footnotes below:
For the Three Months Ended
Dec 31,
2015
Sep 30,
2015
Jun 30,
2015
Mar 31,
2015
Dec 31,
2014
Revised
in
Q1 2015
Sep 30,
2014
Revised
in
Q1 2015
Jun 30,
2014
Revised
in
Q1 2015
Mar 31,
2014
Revised
in
Q1 2015
(users and payers in millions)
Average DAUs 18 19 21 25 24 24 27 28
Average MAUs 68 75 83 100 98 103 121 119
Average MUPs 0.8 0.9 1.0 1.1 1.0 1.2 1.4 1.3
ABPU $0.110 $0.100 $0.091 $0.076 $0.084 $0.079 $0.071 $0.064
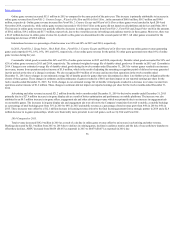
For the Three Months Ended
Dec 31, 2014
As Reported
Sep 30, 2014
As Reported
Jun 30, 2014
As Reported
Mar 31, 2014
As Reported
(users and payers in millions)
Average DAUs 25 26 29 28
Average MAUs 108 112 130 123
Average MUPs 1.1 1.3 1.7 1.4
ABPU $ 0.079 $ 0.073 $ 0.067 $ 0.063
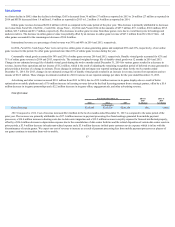
For the Three Months Ended
Dec
31,
2015
Sep
30,
2015
Jun
30,
2015
Mar
31,
2015
Dec
31,
2014
Sep
30,
2014
Jun
30,
2014
Mar
31,
2014
(users in millions)
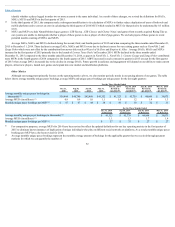
Average MUUs
Revised in Q3 2015 48 51 60 71 64 66 77 74
Revised in Q1 2015 N/A N/A 62 73 66 65 82 79
As Reported in 2014 N/A N/A N/A N/A 71 77 89 86
In the first quarter of 2015, the company modified its calculation to take into account our business’s transition to mobile and updates to our operating metrics
which utilize additional third party data to help us
51
(1) (1) (1) (1)
(3)
(3)
(3)
(2)
(1)
(1)