Zynga 2015 Annual Report Download - page 61
Download and view the complete annual report
Please find page 61 of the 2015 Zynga annual report below. You can navigate through the pages in the report by either clicking on the pages listed below, or by using the keyword search tool below to find specific information within the annual report.-
 1
1 -
2
-
3
-
4
-
5
-
6
-
7
-
8
-
9
-
10
-
11
-
12
-
13
-
14
-
15
-
16
-
17
-
18
-
19
-
20
-
21
-
22
-
23
-
24
-
25
-
26
-
27
-
28
-
29
-
30
-
31
-
32
-
33
-
34
-
35
-
36
-
37
-
38
-
39
-
40
-
41
-
42
-
43
-
44
-
45
-
46
-
47
-
48
-
49
-
50
-
 51
51 -
 52
52 -
 53
53 -
 54
54 -
 55
55 -
 56
56 -
 57
57 -
 58
58 -
 59
59 -
 60
60 -
 61
61 -
 62
62 -
 63
63 -
 64
64 -
 65
65 -
 66
66 -
 67
67 -
 68
68 -
 69
69 -
 70
70 -
 71
71 -
72
-
73
-
74
-
75
-
76
-
77
-
78
-
79
-
80
-
81
-
82
-
83
-
84
-
85
-
86
-
87
-
88
-
89
-
90
-
91
-
92
-
93
-
94
-
95
-
96
-
97
-
98
-
99
-
100
-
101
-
102
-
103
-
104
-
105
-
106
-
107
-
108
-
109
-
110
-
111
-
112
-
113
-
114
-
115
-
116
-
117
-
118
-
119
-
120
-
121
-
122
-
123
-
124
-
125
-
126
-
127
-
128
-
129
-
130
-
131
-
132
-
133
-
134
-
135
-
136
-
137
-
138
-
139
-
140
-
141
-
142
-
143
-
144
-
145
-
146
-
147
-
148
-
149
-
150
-
151
 |
 |

Table of Contents
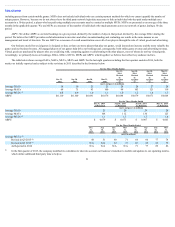
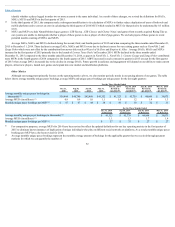
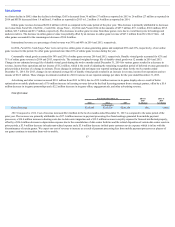
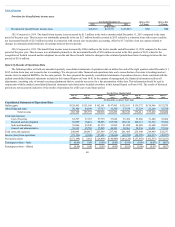
2014 Compared to 2013. Cost of revenue decreased $34.8 million in the twelve months ended December 31, 2014 as compared to the same period of the
prior year. The decrease was primarily attributable to a $38.1 million decrease in depreciation expense due to the consolidation of data center facilities and the
related disposition of certain data center assets in prior periods, a $23.1 million decrease in hosting and data center costs due to lower data usage, an $11.7 million
decrease in third party customer service expense which is in line with the discontinuance of certain games and a $5.1 million decrease in headcount-related
expense, offset by a $36.8 million increase in payment processing fees from mobile payment processors due to an increase in mobile bookings and a $6.3 million
increase in royalty expense for licensed intellectual property.
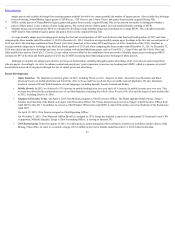
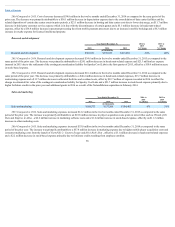
Researchanddevelopment
Year Ended December 31, 2014 to
2015
% Change
2013 to
2014
% Change 2015 2014 2013
(in thousands)
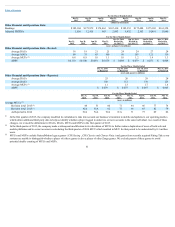
Research and development $361,931 $396,553 $413,001 (9)% (4)%
2015 Compared to 2014. Research and development expenses decreased $34.6 million in the twelve months ended December 31, 2015 as compared to the
same period of the prior year. The decrease was primarily attributable to a $24.1 million decrease in headcount-related expense and $23.3 million less expense
incurred in 2015 due to the settlement of the contingent consideration liability for Spooky Cool Labs in the first quarter of 2015, offset by a $10.9 million increase
in stock-based expense.
2014 Compared to 2013. Research and development expenses decreased $16.4 million in the twelve months ended December 31, 2014 as compared to the
same period of the prior year. The decrease was primarily attributable to a $46.4 million decrease in headcount-related expenses, $13.7 million decrease in
restructuring expense and a $13.7 million decrease in allocated facilities and overhead costs, offset by $32.7 million of expense recorded in 2014 to reflect the
change in estimated fair value of the contingent consideration liability for Spooky Cool Labs and a $21.7 million increase in stock-based expense primarily due to
higher forfeiture credits in the prior year and additional grants in 2014 as a result of the NaturalMotion acquisition in February 2014.
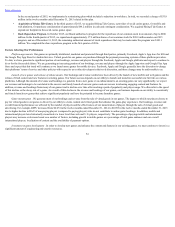
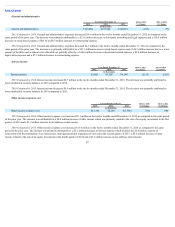
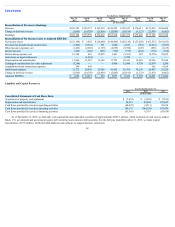
Salesandmarketing
Year Ended December 31, 2014 to
2015
% Change
2013 to
2014
% Change 2015 2014 2013
(in thousands)
Sales and marketing $ 169,573 $157,364 $104,403 8% 51%
2015 Compared to 2014. Sales and marketing expenses increased $12.2 million in the twelve months ended December 31, 2015 as compared to the same
period of the prior year. The increase was primarily attributable to an $18.8 million increase in player acquisition costs spent on newer titles such as Wizard of Oz
Slots and Empires & Allies , a $2.6 million increase in marketing software costs and a $1.6 million increase in stock-based expense, offset by an $11.3 million
decrease in other marketing costs.
2014 Compared to 2013. Sales and marketing expenses increased $53.0 million in the twelve months ended December 31, 2014 as compared to the same
period of the prior year. The increase was primarily attributable to a $57.8 million increase in marketing expense due to higher mobile player acquisition costs and
consumer marketing costs from the launch of FarmVille 2: Country Escape and Hit it Rich! Slots , offset by a $3.1 million decrease in headcount-related expenses
and a $2.2 million decrease in stock-based expense primarily due to forfeiture credits resulting from employee attrition.
58