Zynga 2015 Annual Report Download - page 57
Download and view the complete annual report
Please find page 57 of the 2015 Zynga annual report below. You can navigate through the pages in the report by either clicking on the pages listed below, or by using the keyword search tool below to find specific information within the annual report.-
 1
1 -
2
-
3
-
4
-
5
-
6
-
7
-
8
-
9
-
10
-
11
-
12
-
13
-
14
-
15
-
16
-
17
-
18
-
19
-
20
-
21
-
22
-
23
-
24
-
25
-
26
-
27
-
28
-
29
-
30
-
31
-
32
-
33
-
34
-
35
-
36
-
37
-
38
-
39
-
40
-
41
-
42
-
43
-
44
-
45
-
46
-
 47
47 -
 48
48 -
 49
49 -
 50
50 -
 51
51 -
 52
52 -
 53
53 -
 54
54 -
 55
55 -
 56
56 -
 57
57 -
 58
58 -
 59
59 -
 60
60 -
 61
61 -
 62
62 -
 63
63 -
 64
64 -
 65
65 -
 66
66 -
 67
67 -
68
-
69
-
70
-
71
-
72
-
73
-
74
-
75
-
76
-
77
-
78
-
79
-
80
-
81
-
82
-
83
-
84
-
85
-
86
-
87
-
88
-
89
-
90
-
91
-
92
-
93
-
94
-
95
-
96
-
97
-
98
-
99
-
100
-
101
-
102
-
103
-
104
-
105
-
106
-
107
-
108
-
109
-
110
-
111
-
112
-
113
-
114
-
115
-
116
-
117
-
118
-
119
-
120
-
121
-
122
-
123
-
124
-
125
-
126
-
127
-
128
-
129
-
130
-
131
-
132
-
133
-
134
-
135
-
136
-
137
-
138
-
139
-
140
-
141
-
142
-
143
-
144
-
145
-
146
-
147
-
148
-
149
-
150
-
151
 |
 |

Table of Contents
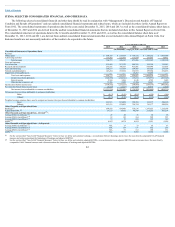
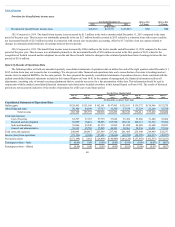
In the second quarter of 2015, we implemented a restructuring plan which included a reduction in workforce. In total, we recorded a charge of $33.8
million in the twelve months ended December 31, 2015 related to this plan.
• AcquisitionofRisingTideGames.In the third quarter of 2015, we acquired Rising Tide Games, a provider of social casino games, for mobile and
web platforms, for purchase consideration of approximately $44.2 million in cash and contingent consideration. We acquired Rising Tide Games to
expand our footprint in the social casino games space.
• StockRepurchaseProgram.In October 2015, our Board authorized a program for the repurchase of our common stock in an amount of up to $200
million. In the fourth quarter of 2015, we repurchased approximately 37.9 million shares of our common stock for $98.9 million under our 2015
program, and as of December 31, 2015, the remaining authorized amount of stock repurchases that may be made under the program was $101.1
million. We completed the share repurchase program in the first quarter of 2016.
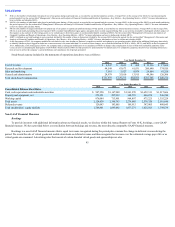
Factors Affecting Our Performance
Platform agreements. Our games are primarily distributed, marketed and promoted through third parties, primarily Facebook, Apple’s App store for iOS and
the Google Play App Store for Android devices. Virtual goods for our games are purchased through the payment processing systems of these platform providers.
To date, we have generated a significant portion of our bookings, revenue and players through the Facebook, Apple and Google platforms and expect to continue to
do so for the foreseeable future. We are generating an increasing portion of our bookings, revenue and players through the Apple App store and Google Play App
Store and expect that this trend will continue as we launch more games for mobile devices. Facebook, Apple and Google generally have the discretion to change
their platforms’ terms of service and other policies with respect to us or other developers in their sole discretion, and those changes may be unfavorable to us.
Launch of new games and release of enhancements. Our bookings and revenue results have been driven by the launch of new mobile and web games and the
release of fresh content and new features in existing games. Our future success depends on our ability to launch and monetize successful new hit titles on various
platforms. Although the amount of revenue and bookings we generate from a new game or an enhancement to an existing game can vary significantly, we expect
our revenue and bookings to be correlated to the success and timely launch of our new games and our success in releasing engaging content and features. In
addition, revenue and bookings from many of our games tend to decline over time after reaching a peak of popularity and player usage. We often refer to the speed
of this decline as the decay rate of a game. As a result of this decline in the revenue and bookings of our games, our business depends on our ability to consistently
and timely launch new games that achieve significant popularity and have the potential to become franchise games.
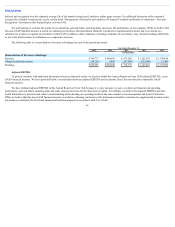
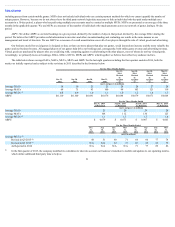
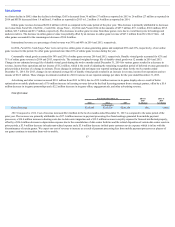
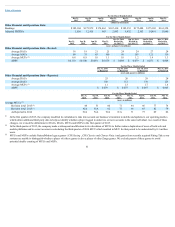
Game monetization . We generate most of our bookings and revenue from the sale of virtual goods in our games. The degree to which our players choose to
pay for virtual goods in our games is driven by our ability to create content and virtual goods that enhance the game-play experience. Our bookings, revenue and
overall financial performance are affected by the number of players and the effectiveness of our monetization of players through the sale of virtual goods and
advertising. For example ABPU increased from $0.074 in the twelve months ended December 31, 2014 to $0.093 in the twelve months ended December 31, 2015
due to higher decline in DAU of non-paying players (compared to paying players) who do not contribute to online game bookings. In addition, mobile and
international players have historically monetized at a lower level than web and U.S. players, respectively. The percentage of paying mobile and international
players may increase or decrease based on a number of factors, including growth in mobile games as a percentage of total game audience and our overall
international players, localization of content and the availability of payment options.
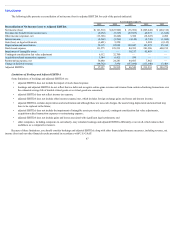
Investment in game development . In order to develop new games and enhance the content and features in our existing games, we must continue to invest in a
significant amount of engineering and creative resources.
54