Zynga 2015 Annual Report Download - page 91
Download and view the complete annual report
Please find page 91 of the 2015 Zynga annual report below. You can navigate through the pages in the report by either clicking on the pages listed below, or by using the keyword search tool below to find specific information within the annual report.-
 1
1 -
2
-
3
-
4
-
5
-
6
-
7
-
8
-
9
-
10
-
11
-
12
-
13
-
14
-
15
-
16
-
17
-
18
-
19
-
20
-
21
-
22
-
23
-
24
-
25
-
26
-
27
-
28
-
29
-
30
-
31
-
32
-
33
-
34
-
35
-
36
-
37
-
38
-
39
-
40
-
41
-
42
-
43
-
44
-
45
-
46
-
47
-
48
-
49
-
50
-
51
-
52
-
53
-
54
-
55
-
56
-
57
-
58
-
59
-
60
-
61
-
62
-
63
-
64
-
65
-
66
-
67
-
68
-
69
-
70
-
71
-
72
-
73
-
74
-
75
-
76
-
77
-
78
-
79
-
80
-
 81
81 -
 82
82 -
 83
83 -
 84
84 -
 85
85 -
 86
86 -
 87
87 -
 88
88 -
 89
89 -
 90
90 -
 91
91 -
 92
92 -
 93
93 -
 94
94 -
 95
95 -
 96
96 -
 97
97 -
 98
98 -
 99
99 -
 100
100 -
 101
101 -
102
-
103
-
104
-
105
-
106
-
107
-
108
-
109
-
110
-
111
-
112
-
113
-
114
-
115
-
116
-
117
-
118
-
119
-
120
-
121
-
122
-
123
-
124
-
125
-
126
-
127
-
128
-
129
-
130
-
131
-
132
-
133
-
134
-
135
-
136
-
137
-
138
-
139
-
140
-
141
-
142
-
143
-
144
-
145
-
146
-
147
-
148
-
149
-
150
-
151
 |
 |
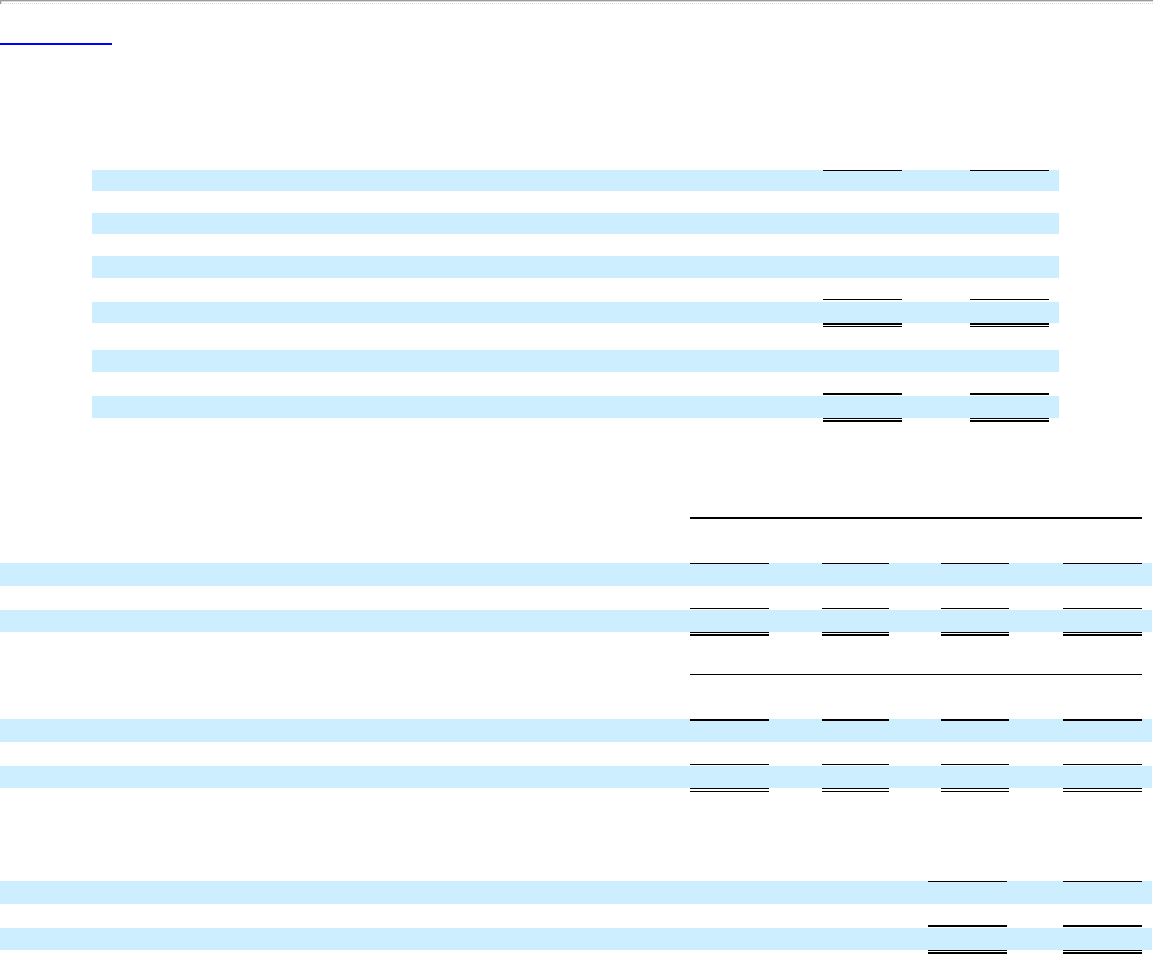
Table of Contents
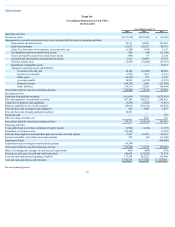
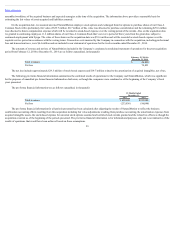
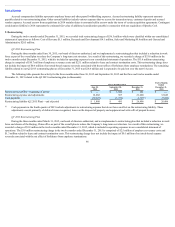
2. Cash and Investments
Cash and investments consist of the following (in thousands):
December 31,
2015
December 31,
2014
Cash and cash equivalents:
Cash $ 162,495 $ 89,708
Money market funds 362,587 41,595
Commercial paper 160,151 —
Corporate bonds 16,995 —
US government and government agency debt securities 39,989 —
Total cash and cash equivalents $ 742,217 $ 131,303
Marketable securities:
U.S. government and government agency debt securities $ 144,986 $ 404,982
Corporate debt securities 100,047 611,624
Total $ 245,033 $1,016,606
The following tables summarize our amortized cost, gross unrealized gains and losses and fair value of our available-for-sale investments in marketable
securities (in thousands):
December 31, 2015
Amortized
Cost
Gross
Unrealized
Gains
Gross
Unrealized
Losses
Aggregate
Fair Value
U.S. government and government agency debt securities $ 145,066 $ — $ (80) $ 144,986
Corporate debt securities 100,093 12 (58) 100,047
$ 245,159 $ 12 $ (138) $ 245,033
December 31, 2014
Amortized
Cost
Gross
Unrealized
Gains
Gross
Unrealized
Losses
Aggregate
Fair Value
U.S. government and government agency debt securities $ 405,049 $ 68 $ (135) $ 404,982
Corporate debt securities 611,950 39 (365) 611,624
$1,016,999 $ 107 $ (500) $1,016,606
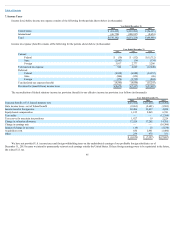
The estimated fair value of available-for-sale marketable securities, classified by their contractual maturities was as follows (in thousands):
December 31,
2015
December 31,
2014
Due within one year $ 245,033 $ 785,221
After one year through three years — 231,385
Total $ 245,033 $1,016,606
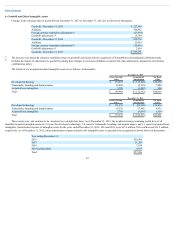
Changes in market interest rates and bond yields cause certain of our investments to fall below their cost basis, resulting in unrealized losses on marketable
securities. As of December 31, 2015, we had unrealized losses of $0.1 million related to marketable securities that had a fair value of $199.1 million. As of
December 31, 2014,
88