Zynga 2015 Annual Report Download - page 78
Download and view the complete annual report
Please find page 78 of the 2015 Zynga annual report below. You can navigate through the pages in the report by either clicking on the pages listed below, or by using the keyword search tool below to find specific information within the annual report.-
 1
1 -
2
-
3
-
4
-
5
-
6
-
7
-
8
-
9
-
10
-
11
-
12
-
13
-
14
-
15
-
16
-
17
-
18
-
19
-
20
-
21
-
22
-
23
-
24
-
25
-
26
-
27
-
28
-
29
-
30
-
31
-
32
-
33
-
34
-
35
-
36
-
37
-
38
-
39
-
40
-
41
-
42
-
43
-
44
-
45
-
46
-
47
-
48
-
49
-
50
-
51
-
52
-
53
-
54
-
55
-
56
-
57
-
58
-
59
-
60
-
61
-
62
-
63
-
64
-
65
-
66
-
67
-
 68
68 -
 69
69 -
 70
70 -
 71
71 -
 72
72 -
 73
73 -
 74
74 -
 75
75 -
 76
76 -
 77
77 -
 78
78 -
 79
79 -
 80
80 -
 81
81 -
 82
82 -
 83
83 -
 84
84 -
 85
85 -
 86
86 -
 87
87 -
 88
88 -
89
-
90
-
91
-
92
-
93
-
94
-
95
-
96
-
97
-
98
-
99
-
100
-
101
-
102
-
103
-
104
-
105
-
106
-
107
-
108
-
109
-
110
-
111
-
112
-
113
-
114
-
115
-
116
-
117
-
118
-
119
-
120
-
121
-
122
-
123
-
124
-
125
-
126
-
127
-
128
-
129
-
130
-
131
-
132
-
133
-
134
-
135
-
136
-
137
-
138
-
139
-
140
-
141
-
142
-
143
-
144
-
145
-
146
-
147
-
148
-
149
-
150
-
151
 |
 |

Table of Contents
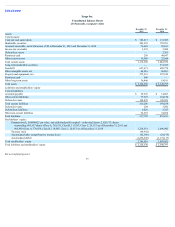
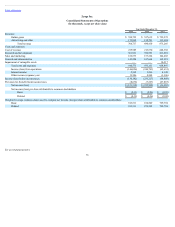
Zynga Inc.
Consolidated Balance Sheets
(Inthousands,exceptparvalue)
December 31,
2015
December 31,
2014
Assets
Current assets:
Cash and cash equivalents $ 742,217 $ 131,303
Marketable securities 245,033 785,221
Accounts receivable, net of allowance of $0 at December 31, 2015 and December 31, 2014 79,610 89,611
Income tax receivable 5,233 3,304
Deferred tax assets — 2,765
Restricted cash 209 48,047
Other current assets 39,988 22,688
Total current assets 1,112,290 1,082,939
Long-term marketable securities — 231,385
Goodwill 657,671 650,778
Other intangible assets, net 64,016 66,861
Property and equipment, net 273,221 297,919
Restricted cash 986 —
Other long-term assets 16,446 18,911
Total assets $ 2,124,630 $ 2,348,793
Liabilities and stockholders’ equity
Current liabilities:
Accounts payable $ 29,676 $ 14,965
Other current liabilities 77,691 164,150
Deferred revenue 128,839 189,923
Total current liabilities 236,206 369,038
Deferred revenue 204 3,882
Deferred tax liabilities 6,026 5,323
Other non-current liabilities 95,293 74,858
Total liabilities 337,729 453,101
Stockholders’ equity:
Common stock, $.00000625 par value, and additional paid in capital—authorized shares: 2,020,517; shares
outstanding: 903,617 shares (Class A, 769,533, Class B, 113,567, Class C, 20,517) as of December 31, 2015 and
905,860 (Class A, 770,658, Class B, 114,685, Class C, 20,517) as of December 31, 2014 3,234,551 3,096,982
Treasury stock (98,942) —
Accumulated other comprehensive income (loss) (52,388) (29,175)
Accumulated deficit (1,296,320) (1,172,115)
Total stockholders’ equity 1,786,901 1,895,692
Total liabilities and stockholders’ equity $ 2,124,630 $ 2,348,793
See accompanying notes.
75