Zynga 2015 Annual Report Download - page 55
Download and view the complete annual report
Please find page 55 of the 2015 Zynga annual report below. You can navigate through the pages in the report by either clicking on the pages listed below, or by using the keyword search tool below to find specific information within the annual report.-
 1
1 -
2
-
3
-
4
-
5
-
6
-
7
-
8
-
9
-
10
-
11
-
12
-
13
-
14
-
15
-
16
-
17
-
18
-
19
-
20
-
21
-
22
-
23
-
24
-
25
-
26
-
27
-
28
-
29
-
30
-
31
-
32
-
33
-
34
-
35
-
36
-
37
-
38
-
39
-
40
-
41
-
42
-
43
-
44
-
 45
45 -
 46
46 -
 47
47 -
 48
48 -
 49
49 -
 50
50 -
 51
51 -
 52
52 -
 53
53 -
 54
54 -
 55
55 -
 56
56 -
 57
57 -
 58
58 -
 59
59 -
 60
60 -
 61
61 -
 62
62 -
 63
63 -
 64
64 -
 65
65 -
66
-
67
-
68
-
69
-
70
-
71
-
72
-
73
-
74
-
75
-
76
-
77
-
78
-
79
-
80
-
81
-
82
-
83
-
84
-
85
-
86
-
87
-
88
-
89
-
90
-
91
-
92
-
93
-
94
-
95
-
96
-
97
-
98
-
99
-
100
-
101
-
102
-
103
-
104
-
105
-
106
-
107
-
108
-
109
-
110
-
111
-
112
-
113
-
114
-
115
-
116
-
117
-
118
-
119
-
120
-
121
-
122
-
123
-
124
-
125
-
126
-
127
-
128
-
129
-
130
-
131
-
132
-
133
-
134
-
135
-
136
-
137
-
138
-
139
-
140
-
141
-
142
-
143
-
144
-
145
-
146
-
147
-
148
-
149
-
150
-
151
 |
 |

Table of Contents
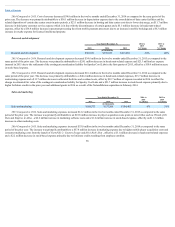
identify whether a player logged in under two or more accounts is the same individual. As a result of these changes, we revised the definitions for DAUs,
MAUs, MUUs and MUPs in the first quarter of 2015.
In the third quarter of 2015, the company made a subsequent modification to its calculation of MUUs to further reduce duplication of users of both web and
mobile platforms and to correct an error in calculating the third quarter of 2014 MUU which resulted in MUU for that period to be understated by 0.3 million
users.
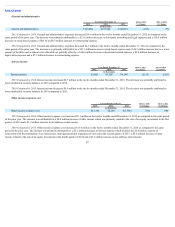
MUUs and MUPs exclude NaturalMotion legacy games ( CSR Racing , CSR Classics and Clumsy Ninja ) and games from recently acquired Rising Tide as
our systems are unable to distinguish whether a player of these games is also a player of other Zynga games. We exclude payers of these games to avoid
potential double counting of MUUs and MUPs.
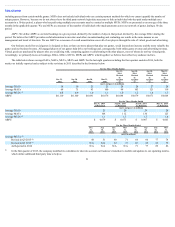
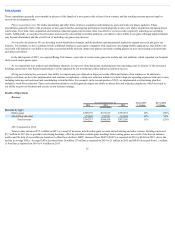
Average DAUs, MAUs and MUUs declined during the second, third, and fourth quarters of 2015 and when comparing the three months ended December 31,
2015 to December 31, 2014. These declines in average DAUs, MAUs and MUUs were due to declines in users for our existing games such as FarmVille 2 and
Zynga Poker which were not offset by the contribution from newer titles such as Wizard of Oz Slots and Empires & Allies . Average DAUs, MAUs and MUUs
increased in the first quarter of 2015 primarily due to the launch of Looney Tunes Dash! in December 2014. MUPs declined in the three months ended
December 31, 2015 compared to the three months ended December 31, 2014, as payers in FarmVille 2 , FarmVille 2: Country Escape and Zynga Poker contributed
more MUPs in the fourth quarter of 2014 compared to the fourth quarter of 2015. ABPU increased in each consecutive quarter in 2015 (except for the first quarter
of 2015 when average DAUs increased) due to the decline in average DAUs. Future growth in audience and engagement will depend on our ability to retain current
players, attract new players, launch new games and expand into new market and distribution platforms.
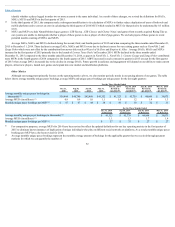
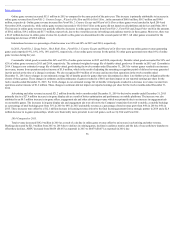
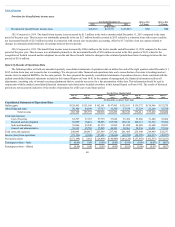
OtherMetrics
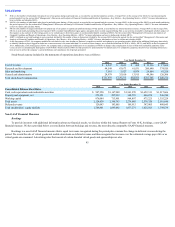
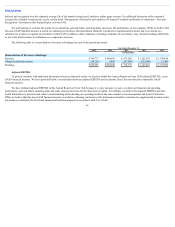
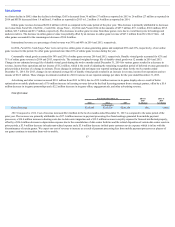
Although our management primarily focuses on the operating metrics above, we also monitor periodic trends in our paying players of our games. The table
below shows average monthly unique payer bookings, average MUPs and unique payer bookings per unique payer for the last eight quarters:
For the Three Months Ended
Dec 31,
2015
Sep 30,
2015
Jun 30,
2015
Mar 31,
2015
Dec 31, 2014
Revised in
Q1 2015
Sep 30, 2014
Revised in
Q1 2015
Jun 30, 2014
Revised in
Q1 2015
Mar 31, 2014
Revised in
Q1 2015
Average monthly unique payer bookings (in
thousands) $38,444 $40,780 $42,488 $41,352 $ 41,323 $ 43,739 $ 44,844 $ 39,073
Average MUPs (in millions) 0.8 0.9 1.0 1.1 1.0 1.2 1.4 1.3
Monthly unique payer bookings per MUP $ 47 $ 47 $ 44 $ 38 $ 41 $ 38 $ 32 $ 31
For the Three Months Ended
Dec 31, 2014
As Reported
Sep 30, 2014
As Reported
Jun 30, 2014
As Reported
Mar 31, 2014
As Reported
Average monthly unique payer bookings (in thousands) $ 41,323 $ 43,739 $ 44,844 $ 39,073
Average MUPs (in millions) 1.1 1.3 1.7 1.4
Monthly unique payer bookings per MUP $ 37 $ 33 $ 27 $ 27
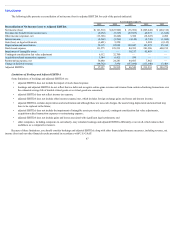
For comparative purposes, average MUPs for 2014 have been revised to reflect the updated definitions for our key operating metrics in the first quarter of
2015 to eliminate known instances of duplication of unique individuals who play on different social networks or platforms. As a result, monthly unique payer
bookings per MUP have also been revised for 2014.
Average monthly unique payer bookings represent the monthly average amount of bookings for the applicable quarter that we received through payment
methods for which we can quantify the number of
52
(2)
(3)
(1) (1) (1) (1)
(2)
(3)
(4)
(2)
(3)
(4)
(1)
(2)