Volvo 2003 Annual Report Download - page 9
Download and view the complete annual report
Please find page 9 of the 2003 Volvo annual report below. You can navigate through the pages in the report by either clicking on the pages listed below, or by using the keyword search tool below to find specific information within the annual report.-
 1
1 -
 2
2 -
 3
3 -
 4
4 -
 5
5 -
 6
6 -
 7
7 -
 8
8 -
 9
9 -
 10
10 -
 11
11 -
 12
12 -
 13
13 -
 14
14 -
 15
15 -
 16
16 -
 17
17 -
 18
18 -
 19
19 -
 20
20 -
21
-
22
-
23
-
24
-
25
-
26
-
27
-
28
-
29
-
30
-
31
-
32
-
33
-
34
-
35
-
36
-
37
-
38
-
39
-
40
-
41
-
42
-
43
-
44
-
45
-
46
-
47
-
48
-
49
-
50
-
51
-
52
-
53
-
54
-
55
-
56
-
57
-
58
-
59
-
60
-
61
-
62
-
63
-
64
-
65
-
66
-
67
-
68
-
69
-
70
-
71
-
72
-
73
-
74
-
75
-
76
-
77
-
78
-
79
-
80
-
81
-
82
-
83
-
84
-
85
-
86
-
87
-
88
-
89
-
90
-
91
-
92
-
93
-
94
-
95
-
96
-
97
-
98
 |
 |
7
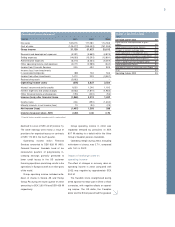
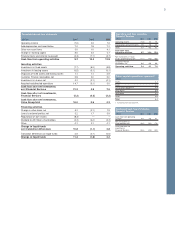
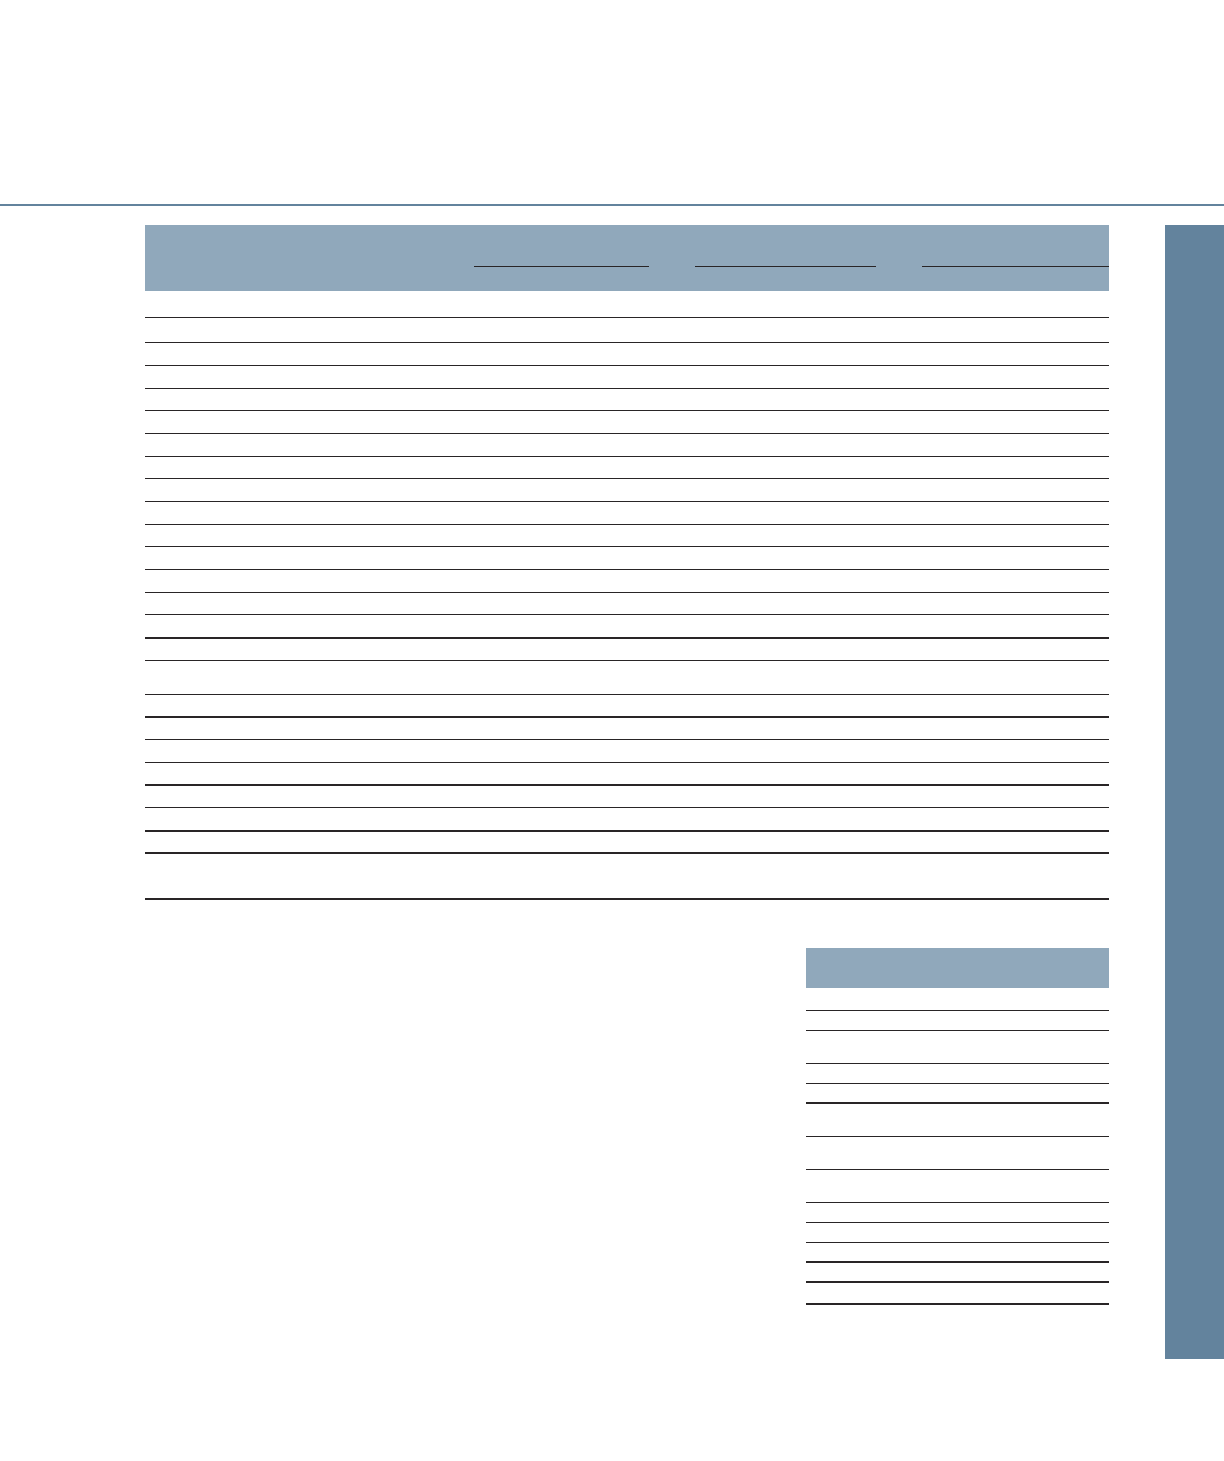
Change in net financial position
SEK bn
December 31, 2002 (6.1)
Cash flow from operating activities 12.9
Investments in fixed assets
and leasing assets, net (5.3)
Investments in shares, net (0.1)
Acquired and divested operations (0.0)
Cash flow after net investments,
excluding Financial Services 7.5
Change in provisions for post-
employment benefits 1(1.5)
Debt in acquired and divested
operations (2.0)
Dividend paid to AB Volvo’s shareholders (3.4)
Currency effect 3.0
Other 0.1
To tal change 3.7
December 31, 2003 (2.4)
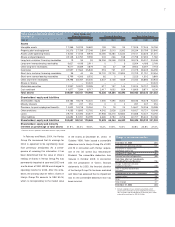
Volvo Group consolidated balance sheets, Volvo Group, excl
December 31 Financial Services 1Financial Services Total Volvo Group
SEK M 2001 2002 2003 2001 2002 2003 2001 2002 2003
Assets
Intangible assets 17,366 16,919 16,662 159 126 94 17,525 17,045 16,756
Property, plant and equipment 30,370 27,789 27,248 2,864 3,010 3,392 33,234 30,799 30,640
Assets under operating leases 15,020 11,155 8,976 14,060 13,284 13,234 27,101 23,525 21,201
Shares and participations 35,145 34,750 9,598 203 236 188 27,798 27,492 1,782
Long-term customer-financing receivables 19 55 53 26,256 25,348 23,918 26,075 25,207 23,448
Long-term interest-bearing receivables 5,627 4,189 2,911 0 7 5 5,554 4,188 2,769
Other long-term receivables 9,017 8,489 7,879 73 47 59 8,902 8,297 7,718
Inventories 30,557 27,564 25,848 518 741 611 31,075 28,305 26,459
Short-term customer-financing receivables 95 44 65 23,732 22,700 22,894 22,709 21,791 22,554
Short-term interest-bearing receivables 6,799 4,306 6,502 82 0 0 2,525 1,302 3,863
Other short-term receivables 29,798 25,767 25,200 2,647 2,126 1,649 31,044 25,693 24,903
Shares in Scania – – 20,424 – – – – – 20,424
Marketable securities 12,997 16,570 19,385 517 137 144 13,514 16,707 19,529
Cash and bank 11,877 7,584 8,717 2,417 1,602 654 13,869 8,871 9,206
Total assets 204,687 185,181 179,468 73,528 69,364 66,842 260,925 239,222 231,252
Shareholders’ equity and liabilities
Shareholders’ equity 85,185 78,278 72,420 7,550 7,494 8,004 85,185 78,278 72,420
Minority interests 391 247 216 0 0 0 391 247 216
Provisions for post-employment benefits 14,632 16,218 15,264 15 18 24 14,647 16,236 15,288
Other provisions 14,085 13,893 12,792 4,342 2,828 2,256 18,427 16,721 15,048
Loans 29,710 22,494 24,677 57,956 54,270 52,852 81,568 72,437 74,092
Other liabilities 60,684 54,051 54,099 3,665 4,754 3,706 60,707 55,303 54,188
Shareholders’ equity and liabilities 204,687 185,181 179,468 73,528 69,364 66,842 260,925 239,222 231,252
Shareholders’ equity and minority
interests as percentage of total assets 41.8% 42.4% 40.5% 10.3% 10.8% 12.0% 32.8% 32.8% 31.4%
1 Financial Services reported in accordance with the equity method.
In February and March, 2004, the Henlys
Group Plc announced that its earnings for
2004 is expected to be significantly lower
than previously anticipated. As a conse-
quence of receiving this information, it has
been determined that the value of Volvo’s
holding of shares in Henlys Group Plc was
permanently impaired at year-end 2003 and
a write-down of SEK 429 M was charged to
operating income for 2003. After this write-
down, the carrying value of Volvo’s shares in
Henlys Group Plc amounts to SEK 95 M,
which is corresponding to the market value
1 Includes adoption of new accounting standards, which
increased the provisions for post-employment benefits by
SEK 2.3 billion and contribution to US pension plans, which
reduced the provisions by SEK 0.8 billion.
of the shares at December 31, 2003. In
October 1999, Volvo issued a convertible
debenture loan to Henlys Group Plc of USD
240 M in connection with Henlys’ acquisi-
tion of the US school bus manufacturer
Bluebird. The convertible debenture loan
matures in October 2009. In connection
with the preparation of Volvo’s financial
statements for 2003, the financial situation
of the Henlys Group Plc has been evaluated
and Volvo has assessed that no impairment
loss on the convertible debenture loan has
been incurred.