Volvo 2003 Annual Report Download - page 46
Download and view the complete annual report
Please find page 46 of the 2003 Volvo annual report below. You can navigate through the pages in the report by either clicking on the pages listed below, or by using the keyword search tool below to find specific information within the annual report.-
 1
1 -
2
-
3
-
4
-
5
-
6
-
7
-
8
-
9
-
10
-
11
-
12
-
13
-
14
-
15
-
16
-
17
-
18
-
19
-
20
-
21
-
22
-
23
-
24
-
25
-
26
-
27
-
28
-
29
-
30
-
31
-
32
-
33
-
34
-
35
-
 36
36 -
 37
37 -
 38
38 -
 39
39 -
 40
40 -
 41
41 -
 42
42 -
 43
43 -
 44
44 -
 45
45 -
 46
46 -
 47
47 -
 48
48 -
 49
49 -
 50
50 -
 51
51 -
 52
52 -
 53
53 -
 54
54 -
 55
55 -
 56
56 -
57
-
58
-
59
-
60
-
61
-
62
-
63
-
64
-
65
-
66
-
67
-
68
-
69
-
70
-
71
-
72
-
73
-
74
-
75
-
76
-
77
-
78
-
79
-
80
-
81
-
82
-
83
-
84
-
85
-
86
-
87
-
88
-
89
-
90
-
91
-
92
-
93
-
94
-
95
-
96
-
97
-
98
 |
 |

44
The Volvo Group
Notes to consolidated financial statements
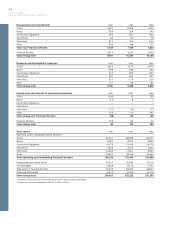
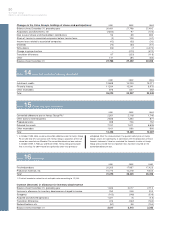
Total assets 2001 2002 2003
Sweden 97,728 91,558 89,747
Europe excluding Sweden 76,288 71,078 75,612
North America 69,748 61,266 50,234
South America 7,851 4,966 4,996
Asia 5,662 7,006 7,236
Other markets 3,648 3,348 3,427
Volvo Group total 260,925 239,222 231,252
Capital expenditures 2001 2002 2003
Sweden 4,646 3,701 2,629
Europe excluding Sweden 5,942 5,793 6,042
North America 3,169 2,261 2,442
South America 166 147 214
Asia 180 194 299
Other markets 36 141 55
Volvo Group total 14,139 12,237 11,681
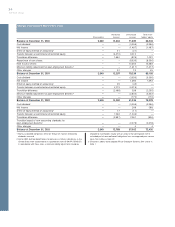
Note 5Other operating income and expenses
2001 2002 2003
Gains/ losses on forward and options contracts (2,044) (195) 1,243
Exchange rate differences on trade receivables and payables 411 (266) (199)
Amortization of goodwill (1,058) (1,094) (873)
Change in allowances for doubtful receivables, customer financing (1,326) (1,018) (812)
Change in allowances for doubtful receivables, other (415) (362) (294)
Surplus funds from Alecta (previously SPP) 43 – –
Gain on sale of Volvia's insurance operations 562 – –
Adjustment of the gain on sale of Volvo Cars 90 – –
Other income and expenses (359) (1,217) (432)
Total (4,096) (4,152) (1,367)
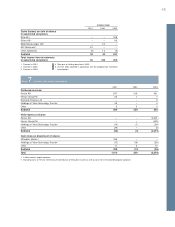
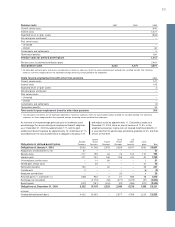
Note 6Income from investments in associated companies
Income from investments in associated companies and dividends recived from associated companies are specified below:
Income (loss) Dividends received
2001 2002 2003 2001 2002 2003
Petro Stopping Centers Holding LP (73) (57) (73) — — —
Aviation Lease Finance 24 51 30 — — —
Other companies (79) 77 15 8 20 —
Holdings no longer reported as
equity method investments
Bilia AB 4151 128 64 42 44 47
Turbec AB 3(67) (67) (77) – – –
Xian Silver Bus Corp 527 29 – – – –
Shanghai Sunwin Bus Corp 5(31) (23) – – – –
AB Volvofinans 146 – – 9– –
Other companies – – – 15 – 4
Subtotal (2) 138 (41) 74 64 51