Volvo 2003 Annual Report Download - page 57
Download and view the complete annual report
Please find page 57 of the 2003 Volvo annual report below. You can navigate through the pages in the report by either clicking on the pages listed below, or by using the keyword search tool below to find specific information within the annual report.-
 1
1 -
2
-
3
-
4
-
5
-
6
-
7
-
8
-
9
-
10
-
11
-
12
-
13
-
14
-
15
-
16
-
17
-
18
-
19
-
20
-
21
-
22
-
23
-
24
-
25
-
26
-
27
-
28
-
29
-
30
-
31
-
32
-
33
-
34
-
35
-
36
-
37
-
38
-
39
-
40
-
41
-
42
-
43
-
44
-
45
-
46
-
 47
47 -
 48
48 -
 49
49 -
 50
50 -
 51
51 -
 52
52 -
 53
53 -
 54
54 -
 55
55 -
 56
56 -
 57
57 -
 58
58 -
 59
59 -
 60
60 -
 61
61 -
 62
62 -
 63
63 -
 64
64 -
 65
65 -
 66
66 -
 67
67 -
68
-
69
-
70
-
71
-
72
-
73
-
74
-
75
-
76
-
77
-
78
-
79
-
80
-
81
-
82
-
83
-
84
-
85
-
86
-
87
-
88
-
89
-
90
-
91
-
92
-
93
-
94
-
95
-
96
-
97
-
98
 |
 |

55
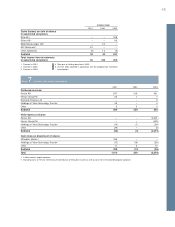
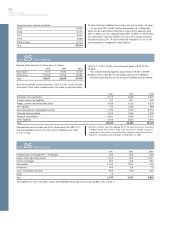
Note 23 Other provisions
Value in Value in Provisions Acquired and Trans- Value in
balance balance and divested lation Reclassi- balance
sheet 2001 sheet 2002 reversals Utilization companies differences fications sheet 2003
Warranties 5,989 5,977 5,687 (5,257) 50 (286) 4 6,175
Provisions in insurance
operations 265 419 (33) – – – 0 386
Restructuring measures 2,342 1,417 41 (516) (5) (103) 107 941
Provisions for residual
value risks 1,716 1,698 (165) (219) 21 (137) 9 1,207
Provisions for
service contracts 1,705 1,478 369 (378) 48 (91) 55 1,481
Other provisions 5,366 4,820 1,645 (1,544) 59 (323) (368) 4,289
Total 17,383 15,809 7,544 (7,914) 173 (940) (193) 14,479
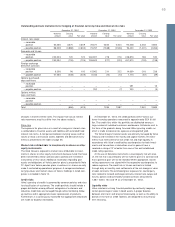
Other loans 2001 2002 2003
USD 1966–2003/ 2005–2015, 1.31–13.0% 10,023 7,280 5,634
EUR 1986–2003/ 2005–2013, 0.5–9.59% 1,453 1,841 3,245
GBP 1995–2001/ 2005–2009, 4.43–7.14% 915 1,028 1,786
SEK 1992–2003/ 2006–2013, 4.15–7.49% 650 224 349
BRL 2000–2003/ 2005–2011, 9.85–21.64% 641 435 626
CAD 2002–2003/ 2006–2008, 3.53–3.7% 80 972 1,527
AUD 2002/ 2005–2006, 5.99–6.43% – 400 208
Other loans 274 369 209
To tal other long-term loans 14,036 12,549 13,584
Deferred leasing income 1,898 1,481 1,186
Residual value liability 7,250 5,121 3,249
Other long-term liabilities 231 102 192
Total 54,130 53,123 51,301
Of the above long-term loans, 1,777 (1,358; 1,703) was secured.
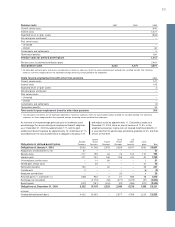
Note 24 Non-current liabilities
Bond loans 2001 2002 2003
GBP 1999/ 2003, 4.6% 154 – –
DKK 1998/ 2005, 4.0% 317 310 58
SEK 1997–2003/ 2005–2008, 3.08–9.8% 2,502 5,950 6,372
JPY 1995–2003/ 2005–2011, 0.13–3.33% 2,130 888 1,443
HKD 1999/ 2006, 7.99% 136 113 94
CZK 2001/ 2005–2010, 2.6–6.5% 466 306 514
USD 1998–2003/ 2005–2008, 1.32–1.78% 2,070 2,154 1,274
EUR 1995–2003/ 2005–2011, 0.1–7.62% 22,907 24,120 23,047
Other bond loans 33 29 288
Total 30,715 33,870 33,090
The listing below shows the Group’s non-current liabilities in which
the largest loans are distributed by currency. Most are issued by
Volvo Treasury AB and Volvo Group Finance Europe BV.
Information on loan terms is as of December 31, 2003. Volvo
hedges foreign-exchange and interest-rate risks using derivative
instruments. See Note 34.