Volvo 2003 Annual Report Download - page 50
Download and view the complete annual report
Please find page 50 of the 2003 Volvo annual report below. You can navigate through the pages in the report by either clicking on the pages listed below, or by using the keyword search tool below to find specific information within the annual report.-
 1
1 -
2
-
3
-
4
-
5
-
6
-
7
-
8
-
9
-
10
-
11
-
12
-
13
-
14
-
15
-
16
-
17
-
18
-
19
-
20
-
21
-
22
-
23
-
24
-
25
-
26
-
27
-
28
-
29
-
30
-
31
-
32
-
33
-
34
-
35
-
36
-
37
-
38
-
39
-
 40
40 -
 41
41 -
 42
42 -
 43
43 -
 44
44 -
 45
45 -
 46
46 -
 47
47 -
 48
48 -
 49
49 -
 50
50 -
 51
51 -
 52
52 -
 53
53 -
 54
54 -
 55
55 -
 56
56 -
 57
57 -
 58
58 -
 59
59 -
 60
60 -
61
-
62
-
63
-
64
-
65
-
66
-
67
-
68
-
69
-
70
-
71
-
72
-
73
-
74
-
75
-
76
-
77
-
78
-
79
-
80
-
81
-
82
-
83
-
84
-
85
-
86
-
87
-
88
-
89
-
90
-
91
-
92
-
93
-
94
-
95
-
96
-
97
-
98
 |
 |

48
The Volvo Group
Notes to consolidated financial statements
Note 13 Shares and participations
1 Machinery and equipment pertains mainly to production equipment.
2 Includes write-downs, 140.
3 Acquisition costs less accumulated depreciation and amortization.
4 Includes subsidiaries and joint ventures that previously were accounted for
according to the equity method.
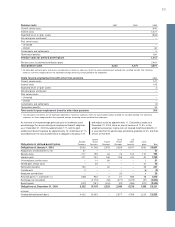
Capital expenditures for property, plant and equipment approved but not yet implemented at December 31, 2003, amounted to SEK 6.4 billion
(5.5; 6.1).
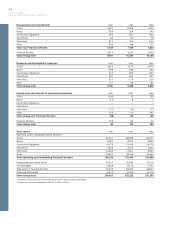
Value in Value in Deprecia- Acquired Trans- Value in Net carrying
Accumulated balance balance tion and and lation Reclassi- balance value in bal-
depreciation and sheet sheet amortiza- Sales/ divested differ- fications sheet ance sheet
amortization 2001 2002 tion 2scrapping operations 4ences and other 2003 2003 3
Goodwill 2,961 3,490 873 (10) (18) (195) (314) 3,826 11,151
Entrance fees,
aircraft engine programs 1,306 1,201 81 – – (10) 19 1,291 930
Product and software
development 3 491 538 – 2 (33) (1) 997 3,895
Other intangible assets 570 747 141 (314) (4) (26) 272 816 780
Total intangible assets 4,840 5,929 1,633 (324) (20) (264) (24) 6,930 16,756
Buildings 6,408 6,445 629 (123) 119 (382) 75 6,763 10,057
Land and land improvements 484 454 58 (7) 9 (44) 13 483 3,641
Machinery and equipment 123,402 23,695 3,322 (1,066) 459 (1,255) (179) 24,976 15,131
Construction in progress,
including advance payments ––––––––1,811
Total property, plant
and equipment 30,294 30,594 4,009 (1,196) 587 (1,681) (91) 32,222 30,640
Assets under operating leases 14,976 15,842 4,527 (2,997) 25 (1,166) (3,078) 13,153 21,201
Total tangible assets 45,270 46,436 8,536 (4,193) 612 (2,847) (3,169) 45,375 51,841
Depreciation and
amortization by type of asset 2001 2002 2003
Intangible assets 1,265 1,586 1,633
Property, plant and equipment 4,545 4,134 4,009
Assets under operating leases 4,151 5,124 4,527
Total 9,961 10,844 10,169
Capital expenditures
by type of asset 2001 2002 2003
Intangible assets 2,574 2,011 1,176
Property, plant and equipment 5,713 4,802 4,939
Assets under operating leases 5,852 5,424 5,566
Total 14,139 12,237 11,681
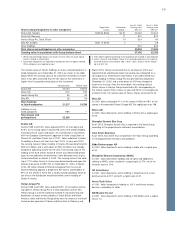
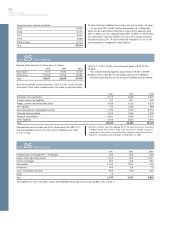
Investment property
Investment property is property owned for the purpose of obtaining
rental income and/ or appreciation in value. The acquisition cost of
investment property was 1,858 at year-end. Capital expenditures
during 2003 amounted to 59. Accumulated depreciation was 409 at
year-end, whereof 62 during 2003. The estimated fair value of
investment property was SEK 2.2 billion at year-end, based on dis-
counted cash flow projections. The required return is based on current
property market conditions for comparable properties in comparable
locations. All investment properties were leased during the year. Net
income for the year was affected by 337 in rental income from
investment properties and 70 in direct costs.
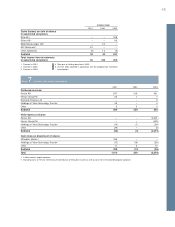
Dec 31, 2002 Dec 31, 2003
Group holdings of shares and participations in Registration Percentage Carrying value Carrying value
non-Group companies number holding 1SEK M 2SEK M 2
Shares in associated companies, equity method of accounting
Aviation Lease Finance USA – 49 172 165
Blue Chip Jet HB, Sweden 969639-1011 40 151 98
Arbustum Invest AB, Sweden 556543-4247 40 32 33
Merakvim Metal Works Ltd, Israel – 27 22 21
Euromation AB, Sweden 556232-0134 53 20 20
Petro Stopping Centers Holdings, LP, USA – 29 80 0
Bilia AB, Sweden 556112-5690 710 –
Shanghai Sunwin Bus Corp, China 3–50139 –
Xian Silver Bus Corp., China 3–50135 –
Other holdings 196 26
Total shares and participations in associated companies 41,657 363