Volvo 2003 Annual Report Download - page 58
Download and view the complete annual report
Please find page 58 of the 2003 Volvo annual report below. You can navigate through the pages in the report by either clicking on the pages listed below, or by using the keyword search tool below to find specific information within the annual report.-
 1
1 -
2
-
3
-
4
-
5
-
6
-
7
-
8
-
9
-
10
-
11
-
12
-
13
-
14
-
15
-
16
-
17
-
18
-
19
-
20
-
21
-
22
-
23
-
24
-
25
-
26
-
27
-
28
-
29
-
30
-
31
-
32
-
33
-
34
-
35
-
36
-
37
-
38
-
39
-
40
-
41
-
42
-
43
-
44
-
45
-
46
-
47
-
 48
48 -
 49
49 -
 50
50 -
 51
51 -
 52
52 -
 53
53 -
 54
54 -
 55
55 -
 56
56 -
 57
57 -
 58
58 -
 59
59 -
 60
60 -
 61
61 -
 62
62 -
 63
63 -
 64
64 -
 65
65 -
 66
66 -
 67
67 -
 68
68 -
69
-
70
-
71
-
72
-
73
-
74
-
75
-
76
-
77
-
78
-
79
-
80
-
81
-
82
-
83
-
84
-
85
-
86
-
87
-
88
-
89
-
90
-
91
-
92
-
93
-
94
-
95
-
96
-
97
-
98
 |
 |

56
The Volvo Group
Notes to consolidated financial statements
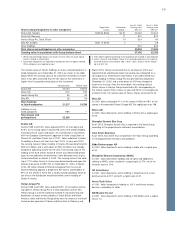
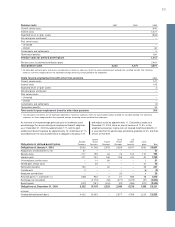
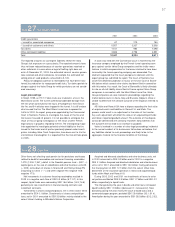
Long-term loans mature as follows:
2005 15,391
2006 9,218
2007 9,665
2008 5,688
2009 or later 6,712
Total 46,674
Of other long-term liabilities the majority will mature within five years.
At year-end 2003, credit facilities granted but not utilized and
which can be used without restrictions amounted to approximately
SEK 15 billion (18; 22). Approximately SEK 13 billion of these facili-
ties consisted of stand-by facilities for loans with varying maturities
through the year 2007. A fee normally not exceeding 0.25% of the
unused portion is charged for credit facilities.
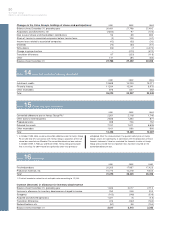
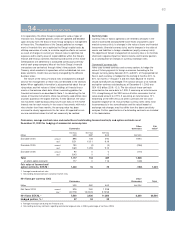
Note 25 Current liabilities
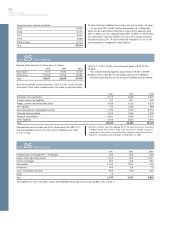
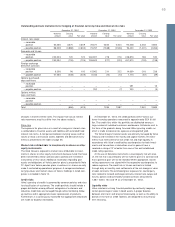
Note 26 Assets pledged
Balance sheet amounts for loans were as follows:
2001 2002 2003
Bank loans 7,417 5,442 3,430
Other loans 129,400 20,576 23,988
Total 36,817 26,018 27,418
14,470 (11,138; 12,608), and commercial paper, 5,836 (8,762;
15,966).
Non-interest-bearing liabilities accounted for 49,561 (48,599;
50,935), or 64% (65; 58) of the Group’s total current liabilities.
Balance sheet amounts for Other current liabilities were as follows:
Bank loans include current maturities, 1,659 (1,046; 1,484), of long-
term loans. Other loans include current maturities of long-term loans,
2001 2002 2003
Advances from customers 3,112 2,589 1,821
Current income tax liabilities 707 621 459
Wages, salaries and withholding taxes 4,368 4,335 4,630
VAT liabilities 772 1,056 988
Accrued expenses and prepaid income 17,724 7,315 8,113
Deferred leasing income 2,033 1,652 1,230
Residual value liability 4,341 3,985 3,201
Other liabilities 5,156 4,832 4,591
Total 28,213 26,385 25,033
Secured bank loans at year-end 2003 amounted to 96 (588; 472).
The corresponding amount for other current liabilities was 1,987
(1,775; 1,732).
The liabilities for which the above assets were pledged amounted at year-end to 3,860 (3,721; 3,907).
2001 2002 2003
Property, plant and equipment – mortgages 264 356 248
Assets under operating leases 1,246 964 2,031
Chattel mortgages 394 495 350
Receivables 1,063 1,180 678
Inventories 199 66 76
Cash, marketable securities 556 549 426
Other 15 – –
Total 3,737 3,610 3,809
1 Effective in 2003, Volvo has adopted RR 27, Financial instrument; Disclosure
and presentation. See further in Note 1. As result of this change of account-
ing principles other loans increased by SEK 3.0 billion and accrued interest
expenses increased by SEK 0.6 billion at December 31, 2003.