Volvo 2003 Annual Report Download - page 27
Download and view the complete annual report
Please find page 27 of the 2003 Volvo annual report below. You can navigate through the pages in the report by either clicking on the pages listed below, or by using the keyword search tool below to find specific information within the annual report.-
 1
1 -
2
-
3
-
4
-
5
-
6
-
7
-
8
-
9
-
10
-
11
-
12
-
13
-
14
-
15
-
16
-
 17
17 -
 18
18 -
 19
19 -
 20
20 -
 21
21 -
 22
22 -
 23
23 -
 24
24 -
 25
25 -
 26
26 -
 27
27 -
 28
28 -
 29
29 -
 30
30 -
 31
31 -
 32
32 -
 33
33 -
 34
34 -
 35
35 -
 36
36 -
 37
37 -
38
-
39
-
40
-
41
-
42
-
43
-
44
-
45
-
46
-
47
-
48
-
49
-
50
-
51
-
52
-
53
-
54
-
55
-
56
-
57
-
58
-
59
-
60
-
61
-
62
-
63
-
64
-
65
-
66
-
67
-
68
-
69
-
70
-
71
-
72
-
73
-
74
-
75
-
76
-
77
-
78
-
79
-
80
-
81
-
82
-
83
-
84
-
85
-
86
-
87
-
88
-
89
-
90
-
91
-
92
-
93
-
94
-
95
-
96
-
97
-
98
 |
 |

25
Future fuels and energy efficiency
Major changes regarding the use of energy
sources, fuels and vehicle powertrains, are
slow processes that must be based on
extensive investigations involving many dif-
ferent aspects. A few of the most important
are possible energy supply, energy efficiency
and greenhouse gas emissions, all of them in
a well-to-wheel perspective.
The Volvo Group has found that DME (Di-
Methyl Ether) has a very strong case as a
long term vehicle fuel, derived both from fos-
sil and renewable sources. The results also
show that the diesel engine will play a vital
role in future drive trains, due to its inherent
energy efficiency and ultra low emission
potential, also together with fuels derived
from renewable sources.
The development of the second genera-
tion heavy duty DME vehicle technology has
continued successfully and a prototype truck
will be presented by Volvo during 2004.
The focused environmental agenda
defines far-reaching objectives for energy
efficiency also in the production processes.
The organization is now being challenged on
how to achieve substantially decreased CO2
emissions in the most cost-effective way.
The production impact
The Volvo Group has production sites on all
continents. Minimum environmental perform-
ance and an ongoing improvement programs
are a requirement at all plants, and have
been followed up by regular audits since
1989. The environmental audits identify en-
vironmental risks and possible need for
clean-up or other corrective actions, with a
follow-up to ensure that these are promptly
conducted. The Volvo Group has insurance
coverage for possible accidental damage to
nearby areas.
At the beginning of 2004, Volvo had a
total of 48 plants for the production of trucks,
buses, construction equipment, marine and
industrial power systems, and aircraft
engines, of which 16 in Sweden. All the
plants have the requisite permits, which in
Sweden cover waste, noise and emissions to
air, water and soil. Two Swedish permits are
to be renewed during 2004 due to a future
increase in production volume.
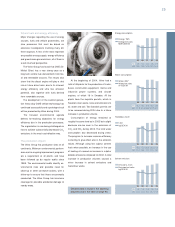
Consumption of energy remained at
roughly the same level as in 2002 but a slight
decrease can be seen in the emissions of
CO2and NOxduring 2003. The total water
consumption also decreased during 2003.
The program to increase resource efficiency
is starting to give effect also in the emission
values. Although using low sulphur content
fuels when possible, an increase in the use
of heating oil caused an increase in sulphur
dioxide emissions compared to 2002. A total
increase in production volumes caused a
minor increase in solvent emissions and
hazardous waste.
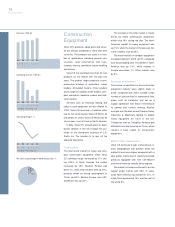
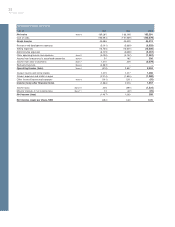
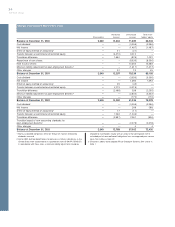
99 00 01 03
1. 8 1.7 2.6 2.6
Energy consumption
Energy, TWh
Energy/net sales
MWh/SEK M
15.6 13.8 14.3 14.9
99 00 01 03
6.7 6.1 9.2 8.6
Water consumption
Water, Mm3
Water/net sales
m3/SEK M
57.8 51.0 50.9 49.1
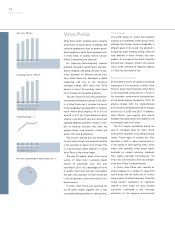
99 00 01 03
15.6 17.2 20.3 21.6
Hazardous waste
k ton
kg/SEK M
13 4 14 3 112 124
99 00 01 03
1.3 1.4 1.8 2.0
Solvent emission
Emissions, k ton
Emission/net sales
kg/SEK M
11.411.8 10.1 11.2
02
2.6
14.5
02
9.2
52.0
02
20.5
116
02
1.9
10.7
Detailed data is found in the adjoining
diagrams and in the table on page 93.