Volvo 2003 Annual Report Download - page 10
Download and view the complete annual report
Please find page 10 of the 2003 Volvo annual report below. You can navigate through the pages in the report by either clicking on the pages listed below, or by using the keyword search tool below to find specific information within the annual report.-
 1
1 -
 2
2 -
 3
3 -
 4
4 -
 5
5 -
 6
6 -
 7
7 -
 8
8 -
 9
9 -
 10
10 -
 11
11 -
 12
12 -
 13
13 -
 14
14 -
 15
15 -
 16
16 -
 17
17 -
 18
18 -
 19
19 -
 20
20 -
 21
21 -
22
-
23
-
24
-
25
-
26
-
27
-
28
-
29
-
30
-
31
-
32
-
33
-
34
-
35
-
36
-
37
-
38
-
39
-
40
-
41
-
42
-
43
-
44
-
45
-
46
-
47
-
48
-
49
-
50
-
51
-
52
-
53
-
54
-
55
-
56
-
57
-
58
-
59
-
60
-
61
-
62
-
63
-
64
-
65
-
66
-
67
-
68
-
69
-
70
-
71
-
72
-
73
-
74
-
75
-
76
-
77
-
78
-
79
-
80
-
81
-
82
-
83
-
84
-
85
-
86
-
87
-
88
-
89
-
90
-
91
-
92
-
93
-
94
-
95
-
96
-
97
-
98
 |
 |
8
The Volvo Group year 2003
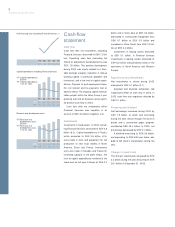
Cash-flow
statement
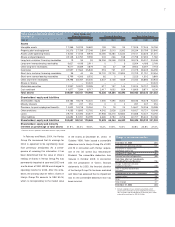
Cash flow
Cash flow after net investments, excluding
Financial Services, amounted to SEK 7.5 bil-
lion. Operating cash flow (excluding the
effects of acquisitions and divestments) was
SEK 7.6 billion. The positive development
during 2003 was mostly related to a favor-
able earnings capacity, reduction in tied-up
working capital, in particular payables and
inventories, and a low level of capital expen-
ditures. Payment of post-employment bene-
fits, net interest and tax payments had an
adverse effect. The ongoing capital rationali-
zation project within the Volvo Group is pro-
gressing well and all business areas report-
ed positive cash flow in 2003.
Cash flow after net investments within
Financial Services was negative in an
amount of SEK 3.2 billion (negative: 4.3).
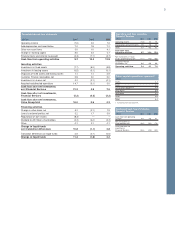
Investments
Investments in fixed assets in 2003, exclud-
ing Financial Services, amounted to SEK 5.8
billion (6.3). Capital expenditures in Trucks,
which amounted to SEK 3.9 billion (4.5),
were made in tools and equipment for the
production of new truck models in North
America, Brasil and France. Investments
were also made in Sweden and France for
increased capacity in the paint shops. The
level of capital expenditures remained at the
same level as last year in Buses at SEK 0.2
billion and in Volvo Aero at SEK 0.3 billion,
decreased in Construction Equipment from
SEK 0.7 billion to SEK 0.5 billion and
increased in Volvo Penta from SEK 0.2 bil-
lion to SEK 0.4 billion.
Investments in leasing assets amounted
to SEK 0.1 billion. In Financial Services
investments in leasing assets amounted to
SEK 5.2 billion and pertained mainly to the
operations in North America and Western
Europe.
Acquisitions and divestments
Net investments in shares during 2003
amounted to SEK 0.1 billion (0.1).
Acquired and divested companies had
insignificant effect on cash flow in 2003. In
2002 cash flow was negatively affected by
SEK 0.1 billion.
Financing and dividend
Net borrowings increased during 2003 by
SEK 1.9 billion, of which new borrowing
during the year, mainly through the issue of
bonds and a commercial paper program,
contributed SEK 25.4 billion. In 2002, net
borrowings decreased by SEK 0.1 billion.
A dividend amounting to SEK 3.4 billion,
corresponding to SEK 8.00 per share, was
paid to AB Volvo's shareholders during the
year.
Change in liquid funds
The Group’s liquid funds increased by SEK
3.2 billion during the year amounting to SEK
28.7 billion at December 31, 2003.
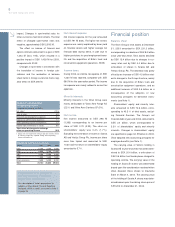
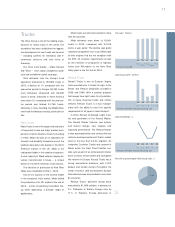
99 00 01 03
5.6 6.3 8.4 6.2
Capital expenditures excluding Financial Services
Capital expenditures,
SEK bn
Capital expenditures,
% of net sales
4.8 5.3 4.6 3.6
99 00 01 03
4.5 4.9 5.4 6.8
Research and development costs
Research and
development costs,
SEK bn
Research and
development costs,
% of net sales
3.6 3.7 2.8 3.7
02
6.8
3.8
02
5.9
3.2
99 00 01 03
12 7 7 2 137 243
Self-financing ratio, excluding Financial Services, %
02
196