Volvo 2003 Annual Report Download - page 7
Download and view the complete annual report
Please find page 7 of the 2003 Volvo annual report below. You can navigate through the pages in the report by either clicking on the pages listed below, or by using the keyword search tool below to find specific information within the annual report.-
 1
1 -
 2
2 -
 3
3 -
 4
4 -
 5
5 -
 6
6 -
 7
7 -
 8
8 -
 9
9 -
 10
10 -
 11
11 -
 12
12 -
 13
13 -
 14
14 -
 15
15 -
 16
16 -
 17
17 -
 18
18 -
19
-
20
-
21
-
22
-
23
-
24
-
25
-
26
-
27
-
28
-
29
-
30
-
31
-
32
-
33
-
34
-
35
-
36
-
37
-
38
-
39
-
40
-
41
-
42
-
43
-
44
-
45
-
46
-
47
-
48
-
49
-
50
-
51
-
52
-
53
-
54
-
55
-
56
-
57
-
58
-
59
-
60
-
61
-
62
-
63
-
64
-
65
-
66
-
67
-
68
-
69
-
70
-
71
-
72
-
73
-
74
-
75
-
76
-
77
-
78
-
79
-
80
-
81
-
82
-
83
-
84
-
85
-
86
-
87
-
88
-
89
-
90
-
91
-
92
-
93
-
94
-
95
-
96
-
97
-
98
 |
 |
5
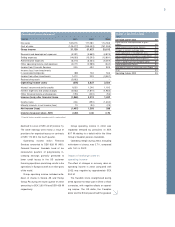
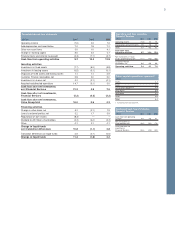
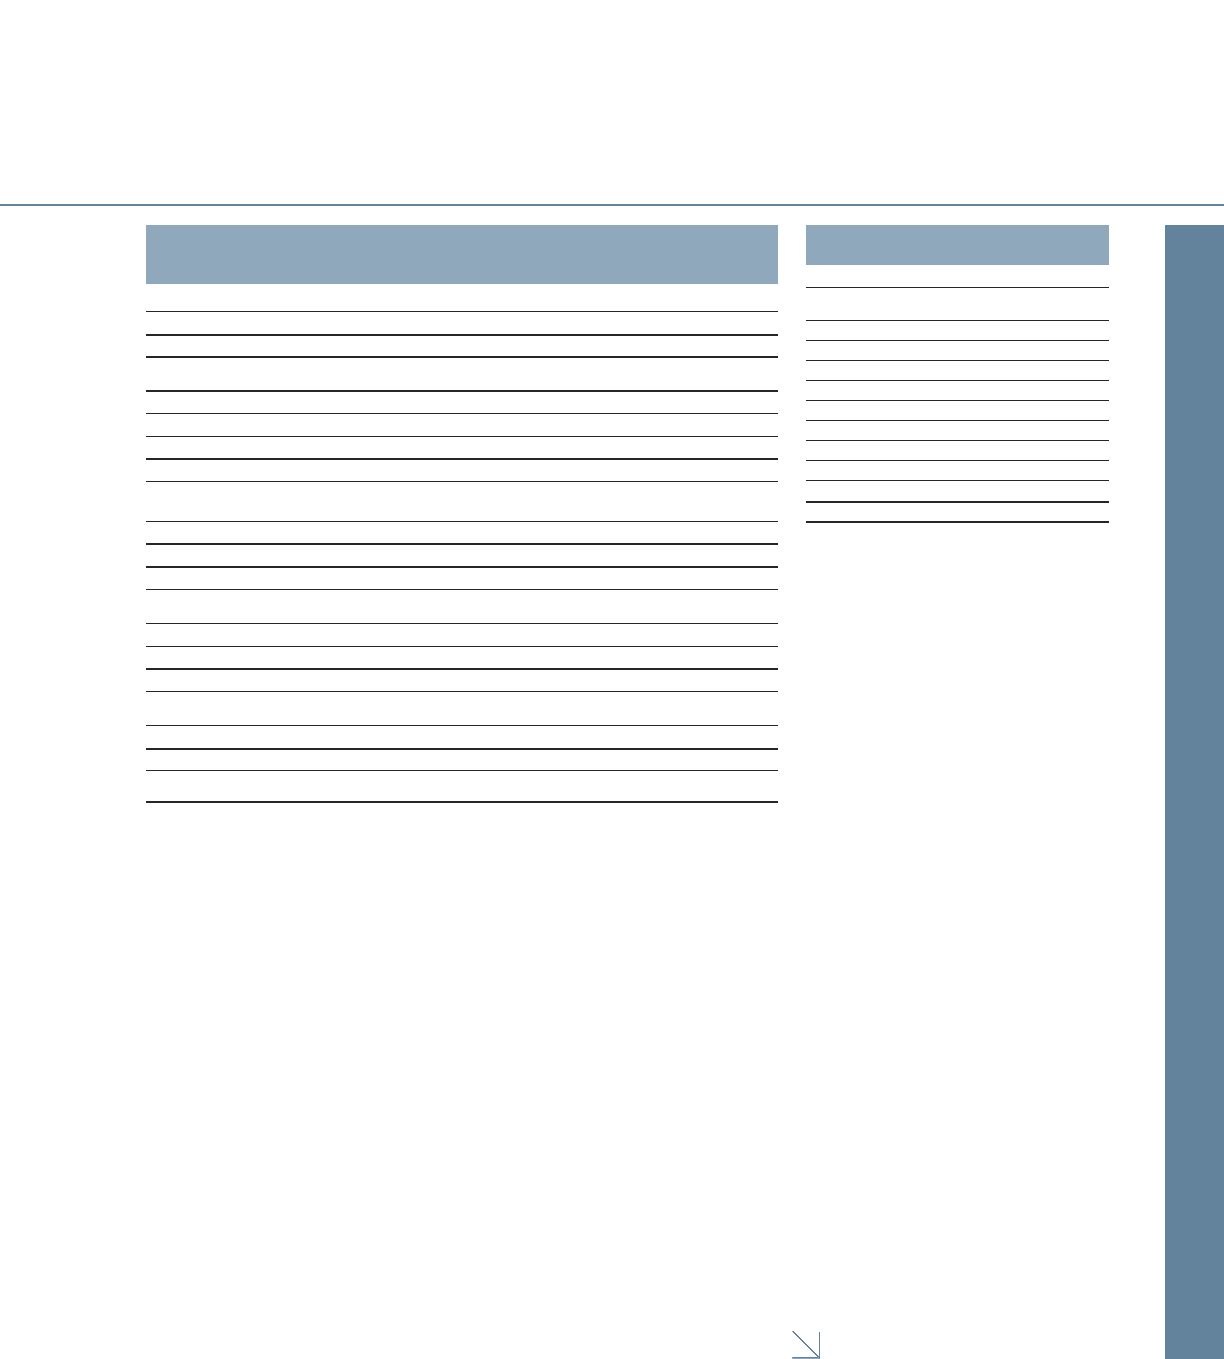
Change of operating income
SEK bn
Operating income 2002 2.8
Higher volumes and improvement of gross
margins 4.8
Higher income from Financial Services 0.4
Changes in currency exchange rates (0.9)
Lower capitalization of development costs (0.8)
Higher research and development expenditures (0.5)
Higher selling and administrative expenses (1.2)
Deficit in Swedish pension foundation 2002 0.8
Higher dividend from Scania 0.2
Write-down of shares in Scania and Henlys Group (4.0)
Other 0.9
Operating income 2003 2.5
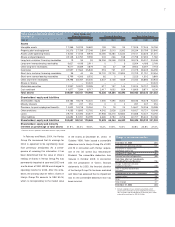
Consolidated income statements1
SEK M 2001 2002 2003
Net sales 180,615 177,080 174,768
Cost of sales (149,477) (145,453) (141,256)
Gross income 31,138 31,627 33,512
Research and development expenses (5,391) (5,869) (6,829)
Selling expenses (14,663) (15,393) (15,891)
Administrative expenses (6,474) (5,464) (5,259)
Other operating income and expenses (3,071) (2,989) (540)
Income from Financial Services 325 490 926
Income (loss) from investments
in associated companies (88) 126 166
Income from other investments 1,410 309 (3,581)
Restructuring costs (3,862) – –
Operating income (loss) (676) 2,837 2,504
Interest income and similar credits 1,653 1,246 1,193
Interest expenses and similar charges (2,653) (1,870) (1,984)
Other financial income and expenses (190) (200) (56)
Income (loss) after financial items (1,866) 2,013 1,657
Income taxes 326 (590) (1,334)
Minority interests in net income (loss) 73 (30) (25)
Net income (loss) (1,467) 1,393 298
Income (loss) per share, SEK (3.50) 3.30 0.70
1 Financial Services reported in accordance with the equity method.
declined to a loss of SEK 44 M (income: 5).
The lower earnings were mainly a result of
provisions for expected losses on contracts
of SEK 170 M in the fourth quarter.
Operating income within Financial
Services amounted to SEK 926 M (490).
Financial Services’ favorable trend of ten
consecutive quarters of progressively in-
creasing earnings primarily pertained to
lower credit losses in the US customer
financing operations and strong results in the
operations in Europe as well as in other parts
of the world.
Group operating income included write-
down of shares in Scania AB and Henlys
Group Plc during the fourth quarter of 2003
amounting to SEK 3,601 M and SEK 429 M
respectively.
Group operating income in 2002 was
negatively affected by provisions of SEK
807 M relating to a deficit within the Volvo
Group’s Swedish pension foundation.
Operating margin during 2003, excluding
write-down of shares, was 3.7%, compared
with 1.6% in 2002.
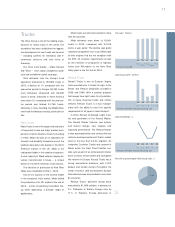
Impact of exchange rates on
operating income
The effect of changes in currency rates on
operating income in 2003 compared with
2002 was negative by approximately SEK
900 M.
The Swedish krona strengthened during
2003 against the major part of Volvo’s inflow
currencies, with negative effects on operat-
ing income. The US dollar, the Canadian
dollar and the British pound had the greatest