Volvo 2003 Annual Report Download - page 12
Download and view the complete annual report
Please find page 12 of the 2003 Volvo annual report below. You can navigate through the pages in the report by either clicking on the pages listed below, or by using the keyword search tool below to find specific information within the annual report.-
 1
1 -
 2
2 -
 3
3 -
 4
4 -
 5
5 -
 6
6 -
 7
7 -
 8
8 -
 9
9 -
 10
10 -
 11
11 -
 12
12 -
 13
13 -
 14
14 -
 15
15 -
 16
16 -
 17
17 -
 18
18 -
 19
19 -
 20
20 -
 21
21 -
 22
22 -
23
-
24
-
25
-
26
-
27
-
28
-
29
-
30
-
31
-
32
-
33
-
34
-
35
-
36
-
37
-
38
-
39
-
40
-
41
-
42
-
43
-
44
-
45
-
46
-
47
-
48
-
49
-
50
-
51
-
52
-
53
-
54
-
55
-
56
-
57
-
58
-
59
-
60
-
61
-
62
-
63
-
64
-
65
-
66
-
67
-
68
-
69
-
70
-
71
-
72
-
73
-
74
-
75
-
76
-
77
-
78
-
79
-
80
-
81
-
82
-
83
-
84
-
85
-
86
-
87
-
88
-
89
-
90
-
91
-
92
-
93
-
94
-
95
-
96
-
97
-
98
 |
 |

10
The Volvo Group year 2003
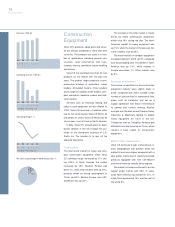
Financial targets
Volvo’s ambition for the period up to 2005 is
to achieve a sustainable level of profitability
above the industry average. Sustainable
profitability is driven by strong and profitable
growth combined with a high degree of
operating efficiency. At the same time a
strong capital structure is essential in order
to maintain investments on a competitive
level – with the ultimate aim of providing
world-class products and services. In order
to achieve the strategy for growth and gen-
erate a competitive return for our sharehold-
ers, Volvo has set a number of Group-wide
financial targets covering growth, operating
margin, return on equity and capital struc-
ture. These financial targets are set and eval-
uated over a business cycle.
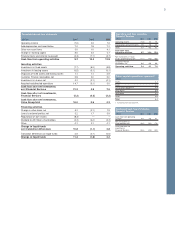
Sales growth
Volvo’s ambition is that net sales should
increase by an average of more than 10% on
an annual basis. This objective should be
achieved through both organic growth and
acquisitions. During the period from 1999 to
2003, the average annual growth rate,
excluding divested operations, was 11.7%.
Operating margin
The objective is to maintain an operating
margin of between 5% and 7% over an eco-
nomic cycle. The average annual operating
margin for the Volvo Group during 1999 to
2003 was 2.9%.
Return on equity
Over time, the return on shareholders’ equity
should more than compensate for inflation as
well as for industrial and financial risks. The
objective is to achieve a return on sharehold-
ers’ equity of between 12% and 15% over
an economic cycle. Return on shareholders’
equity during 1999 to 2003 averaged 8.1%
per year.
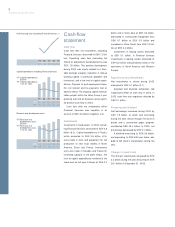
Capital structure
A strong capital structure and a competitive
cash flow is essential in order to be able to
maintain investments in research and devel-
opment, product development and in pro-
duction on competitive levels – and in the
end generate world-class products and serv-
ices.
The Group’s objective is to maintain a net
financial position ratio, excluding Financial
Services, between a net financial assets
position of 15% and a net debt position of
30%. The equity ratio, excluding Financial
Services, should not be lower than 40% and
the equity ratio in Financial Services should
not be lower than 10%.
At the end of December 2003, the net
financial position of the Volvo Group amount-
ed to a net debt of SEK 2.4 billion, corre-
sponding to a net debt ratio of 3.3%. On
December 31, 2003, the equity ratio for the
Group, excluding Financial Services, was
40.5% and the equity ratio for Financial
Services was 12.0%.
99 00 01 03
8350 (1)
Net sales growth*, %
02
(2)
99 00 01 03
6.4 5.5 (0.4) 1.4
Operating margin*, %
02
1.6
99 00 01 03
34.9 5.0 (1.7) 0.4
Return on shareholders´
equity, %
02
1.7
99 00 01 03
29.3 10.6 (8.2) (3.3)
Net financial position as percentage
of shareholders´ equity, %
02
(7.7)
99 00 01 03
67 61 42 40
Equity ratio*, %
02
42
*Excluding divested
operations
*Excluding divested
operations
0
0
7
5
*Excluding divested
operations
0
15
12
15
0
-30
40
10