Volvo 2003 Annual Report Download - page 55
Download and view the complete annual report
Please find page 55 of the 2003 Volvo annual report below. You can navigate through the pages in the report by either clicking on the pages listed below, or by using the keyword search tool below to find specific information within the annual report.-
 1
1 -
2
-
3
-
4
-
5
-
6
-
7
-
8
-
9
-
10
-
11
-
12
-
13
-
14
-
15
-
16
-
17
-
18
-
19
-
20
-
21
-
22
-
23
-
24
-
25
-
26
-
27
-
28
-
29
-
30
-
31
-
32
-
33
-
34
-
35
-
36
-
37
-
38
-
39
-
40
-
41
-
42
-
43
-
44
-
 45
45 -
 46
46 -
 47
47 -
 48
48 -
 49
49 -
 50
50 -
 51
51 -
 52
52 -
 53
53 -
 54
54 -
 55
55 -
 56
56 -
 57
57 -
 58
58 -
 59
59 -
 60
60 -
 61
61 -
 62
62 -
 63
63 -
 64
64 -
 65
65 -
66
-
67
-
68
-
69
-
70
-
71
-
72
-
73
-
74
-
75
-
76
-
77
-
78
-
79
-
80
-
81
-
82
-
83
-
84
-
85
-
86
-
87
-
88
-
89
-
90
-
91
-
92
-
93
-
94
-
95
-
96
-
97
-
98
 |
 |

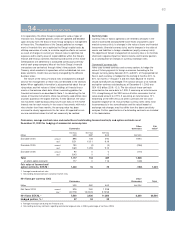
53
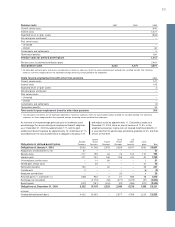
United Great US
Sweden States France Britain Other Other
Obligations in defined benefit plans Pensions Pensions Pensions Pensions benefits plans Total
Obligations at January 1, 2003 5,053 11,748 2,479 3,059 6,917 1,551 30,807
Acquisitions and divestments, net 37 – – – – – 37
Service costs 217 195 34 76 104 127 753
Interest costs 271 742 146 158 414 61 1,792
Unvested past service costs – 14 66 – – 1 81
Vested past service costs – 25 – – – 21 46
Termination benefits 130 – 32 – – 39 201
Curtailments 2 – – – – (5) (3)
Employee contributions – – – 25 – 4 29
Actuarial gains (–) and losses (+ ) (156) 925 6 31 686 48 1,540
Exchange rate translation – (2,175) (26) (271) (1,279) (51) (3,802)
Benefits paid (222) (767) (404) (92) (564) (201) (2,250)
Obligations at December 31, 2003 5,332 10,707 2,333 2,986 6,278 1,595 29,231
of which
Funded defined benefit plans 4,422 10,433 – 2,977 4,769 1,224 23,825
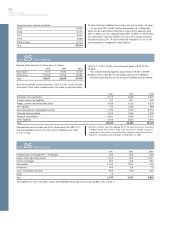
Pension costs 2001 2002 2003
Current service costs 646
Interest costs 1,377
Expected return on plan assets (828)
Actuarial gains and losses 1–
Past service costs
– Unvested –
– Vested 46
Curtailments and settlements 3
Termination benefits 169
Pension costs for defined benefit plans 1,413
Pension costs for defined contribution plans 2,461
Total pension costs 3,332 4,472 3,874
1 For each plan, actuarial gains and losses are reported as income or expenses, when the accumulated amount exceeds the so called corridor. The income or
expenses are then recognized over the expected average remaining service period of the employees.
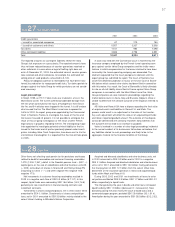
Costs for post-employment benefits other than pensions 2003
Current service costs 107
Interest costs 415
Expected return on plan assets 0
Actuarial gains and losses 1–
Past service costs
– Unvested –
– Vested –
Curtailments and settlements (4)
Termination benefits 32
Total costs for post-employment benefits other than pensions 550
1 Actuarial gains and losses are for each plan reported as income or expenses, when the accumulated amount exceed the so called corridor. The income or
expenses are then recognized over the expected average remaining service period of the employees.
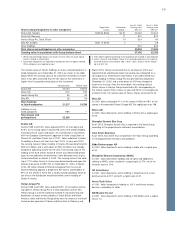
An increase of one percentage point per year in healthcare costs
would change the accumulated post-employment benefit obligation
as of December 31, 2003 by approximately 171, and the post-
employment benefit expense by approximately 13. A decrease of 1%
would decrease the accumulated value of obligations by about 147
and reduce costs by approximately 11. Calculations made as of
December 31, 2003 show an annual increase of 11.5% in the
weighted average per capita costs of covered healthcare benefits; it
is assumed that the percentage will decline gradually to 5% and then
remain at that level.