Volvo 2003 Annual Report Download - page 16
Download and view the complete annual report
Please find page 16 of the 2003 Volvo annual report below. You can navigate through the pages in the report by either clicking on the pages listed below, or by using the keyword search tool below to find specific information within the annual report.-
 1
1 -
2
-
3
-
4
-
5
-
 6
6 -
 7
7 -
 8
8 -
 9
9 -
 10
10 -
 11
11 -
 12
12 -
 13
13 -
 14
14 -
 15
15 -
 16
16 -
 17
17 -
 18
18 -
 19
19 -
 20
20 -
 21
21 -
 22
22 -
 23
23 -
 24
24 -
 25
25 -
 26
26 -
27
-
28
-
29
-
30
-
31
-
32
-
33
-
34
-
35
-
36
-
37
-
38
-
39
-
40
-
41
-
42
-
43
-
44
-
45
-
46
-
47
-
48
-
49
-
50
-
51
-
52
-
53
-
54
-
55
-
56
-
57
-
58
-
59
-
60
-
61
-
62
-
63
-
64
-
65
-
66
-
67
-
68
-
69
-
70
-
71
-
72
-
73
-
74
-
75
-
76
-
77
-
78
-
79
-
80
-
81
-
82
-
83
-
84
-
85
-
86
-
87
-
88
-
89
-
90
-
91
-
92
-
93
-
94
-
95
-
96
-
97
-
98
 |
 |

14
Business Areas
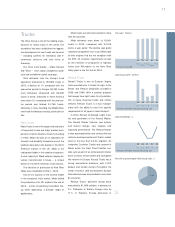
Buses
Volvo Buses has renewed its entire product
range in less than five years. Most of the
new models are based on a common pro-
duct platform for intercity buses and tourist
coaches. The introduction of the TX platform
has provided Volvo one of the most modern
product ranges in the bus industry. The
product range provides efficient transport
solutions and includes complete buses and
chassis for city and intercity traffic as well as
coaches, which meet customers’ and envi-
ronmental demands.
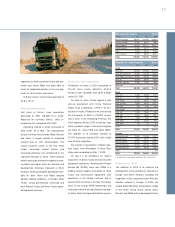
Volvo Buses offers an extended range of
facilities within servicing and financing to be
able to offer all-encompassing customer-
tailored transport solutions with the best
total economy. In 2003, an agreement was
made with Renault Trucks covering the sale
of Volvo buses through Renault’s dealer net-
work in France. The French bus market is
the second largest in Europe and the coop-
eration with Renault Trucks gives Volvo
Buses access to an extensive dealer net-
work for repair, service and spare parts.
To t al market
The market for tourist buses globally
remained very low in 2003, particularly in
North America and Europe. The total market
in Europe is weak, which is attributable
mainly to Central Europe. Strong price pres-
sures continue to prevail. In Asia, the mar-
kets in Hong Kong and Singapore are still at
a low level, while a positive trend was noted
in China. In 2003, the market was stable in
Mexico while markets in South America con-
tinued to be weak, but with a tendency
toward recovery.
Business environment
Within the OECD countries, deregulation
and privatization have altered the operating
conditions for many operators. New actors
are penetrating and establishing a foothold
in previously restricted areas, and competi-
tion between companies is increasing.
There is a move toward fewer and larger
operators who impose high demands on
good overall economics and better potential
for focusing on their core operations. Sign-
ificant bus markets in Europe are in a state
of recession, which results in increased
competition in other markets. The trend
toward consolidation in the bus industry is
prevailing.
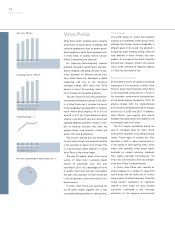
Market share development
Volvo delivered 7,817 (9,059) buses and
bus chassis during 2003. The decline was
mainly attributable to significantly lower vol-
umes in North America, which were offset to
some extent by favorable volumes in China
and the Nordic countries.
Volvo’s market share in Europe remained
at about the same level as in 2002. In the
Nordic region, the UK and Benelux, Volvo
Buses is the market leader, while the market
position in continental Europe remains
weak. In the North American coach market,
a downturn was noted, while the market
share in Mexico, where Volvo is market
leader, showed a sharp increase. In China,
Volvo Buses increased its share of the total
market during 2003.
Financial performance
Net sales in 2003 declined to SEK 11,978
M (14,035). The decrease was largely
explained by lower deliveries, mainly in North
99 00 01 03
14 .7 17.2 16 .7 12.0
Net sales, SEK bn
99 00 01 03
224 440 (524) (361)
Operating income (loss)*, SEK M
99 00 01 03
1.52.6 (3.1) (3.0)
Operating Margin*, %
Net sales as percentage of Volvo Group sales, %
0
0
*excluding restructuring costs and write-down of shares
*excluding restructuring costs and write-down of shares
02
14.0
02
(94)
02
(0.7)
7%