Volvo 2003 Annual Report Download - page 25
Download and view the complete annual report
Please find page 25 of the 2003 Volvo annual report below. You can navigate through the pages in the report by either clicking on the pages listed below, or by using the keyword search tool below to find specific information within the annual report.-
 1
1 -
2
-
3
-
4
-
5
-
6
-
7
-
8
-
9
-
10
-
11
-
12
-
13
-
14
-
 15
15 -
 16
16 -
 17
17 -
 18
18 -
 19
19 -
 20
20 -
 21
21 -
 22
22 -
 23
23 -
 24
24 -
 25
25 -
 26
26 -
 27
27 -
 28
28 -
 29
29 -
 30
30 -
 31
31 -
 32
32 -
 33
33 -
 34
34 -
 35
35 -
36
-
37
-
38
-
39
-
40
-
41
-
42
-
43
-
44
-
45
-
46
-
47
-
48
-
49
-
50
-
51
-
52
-
53
-
54
-
55
-
56
-
57
-
58
-
59
-
60
-
61
-
62
-
63
-
64
-
65
-
66
-
67
-
68
-
69
-
70
-
71
-
72
-
73
-
74
-
75
-
76
-
77
-
78
-
79
-
80
-
81
-
82
-
83
-
84
-
85
-
86
-
87
-
88
-
89
-
90
-
91
-
92
-
93
-
94
-
95
-
96
-
97
-
98
 |
 |

23
estate companies in Sweden, Norway,
Finland, Germany and France that are being
reported through Danafjord. The occupancy
rate at the end of the year was 99.8% (99.9),
and 61% (59) of the total leasing was for
tenants outside the Volvo Group. 76% (77)
of the leases run for five years or more.
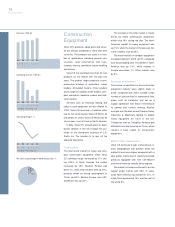
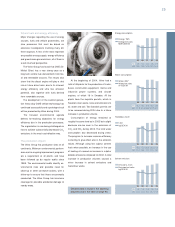
Volume and assets
The total volume of new retail financing in
2003 amounted to SEK 26.8 billion, which
was SEK 0.5 billion higher than 2002. For
the year, Volvo Trucks accounted for 54%
(51) of the volume, Construction Equipment
for 17% (16), Renault Trucks for 15% (13),
Buses for 5% (9) and Mack Trucks for 8%
(9). The remaining 1% (2%) is mainly related
to Volvo Aero and Volvo Penta.
In the markets where financial services are
offered, the average penetration during the
year was 33% for Volvo Trucks, 33% for
Construction Equipment, 17% for Buses,
15% for Renault Trucks and 12% for Mack
Trucks. Expressed as an average, Volvo
Financial Services financed 24% of the
Group’s products sold in the markets where
financing is offered, an increase of 5 per-
centage points from 2002.
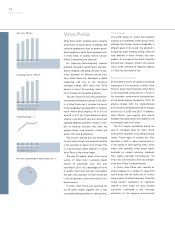
To t al assets as of December 31, 2003
amounted to SEK 67 billion (69), of which
SEK 60 billion (61) was in the net credit
portfolio. Adjusted for the effects of foreign
exchange movements, the credit portfolio
grew by 7% during the year, compared with
a growth of 8% during 2002. The credit port-
folio consists of 54% Volvo Trucks, 16%
Construction Equipment, 10% Buses, 12%
Renault Trucks and 6% Mack Trucks. The
remaining 2% is mainly related to Volvo Aero
and Volvo Penta. From a currency perspec-
tive, 39% of the portfolio was denominated
in EUR, 33% in USD, 12% in GBP and 5%
CAD. The remaining 11% is a mix of other
European and Latin American currencies.
Financial performance
Year-end operating income amounted to
SEK 926 M (490). Return on equity was
9.8% (4.8) with a year-end equity ratio of
12.0% (10.8).
Write-offs in 2003 totaled SEK 848 M
resulting in an annualized write-off ratio for
the year of 1.37% (1.39). Total credit
reserves amounted to SEK 1.3 billion at the
end of December, and the credit reserve
ratio at year-end was 2.14%.
During 2003, VFS built on its foundation
of controlled growth and improved profitabil-
ity. Emphasis on prudent underwriting and
competitive pricing has led to a more stable
portfolio. Delinquencies are trending down-
ward and were at their lowest level in nearly
three years. Furthermore, the 2003 expenses
and operational efficiency statistics demon-
strate VFS was successful in streamlining
daily operations.
Ambitions for 2004
A stabilizing global economy, rebound in
capital spending and a comprehensive line-
up of new Volvo Group products should
serve as a catalyst for improved asset growth
and quality. As competition increases, VFS
will look to protect its share of the market
while maintaining return goals.
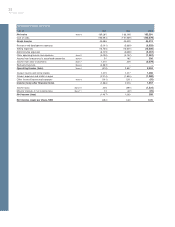
Condensed income statement
SEKM 2001 2002 2003
Net sales 9,495 9,925 9,153
Income after
financial items 325 490 926
Income taxes 10 (134) (170)
Net income 335 356 756
Distribution of credit portfolio, net
%2001 2002 2003
Operational leasing 23 22 22
Financial leasing 27 25 26
Installment contracts 36 37 37
Dealer financing 14 16 13
Other customer credits 0 0 2
Operational excellence initiatives will be
pursued aggressively in 2004 to further
improve efficiency and ability to care for cus-
tomers. VFS also needs to continue
strengthening the processes at both the
front and back-ends of the operations. The
approach will be conservative when moving
into emergin markets. A close watch on the
capital markets is essential so that financial
risks can be managed.
With the know-how of its 1,000 employ-
ees, VFS has the ambition to become a
benchmark in the finance industry. In the
meantime, VFS is on the path of reaching
another of its goals, becoming a solid and
dependable contributor to the Volvo
Group’s earnings.