Volvo 2003 Annual Report Download - page 35
Download and view the complete annual report
Please find page 35 of the 2003 Volvo annual report below. You can navigate through the pages in the report by either clicking on the pages listed below, or by using the keyword search tool below to find specific information within the annual report.-
 1
1 -
2
-
3
-
4
-
5
-
6
-
7
-
8
-
9
-
10
-
11
-
12
-
13
-
14
-
15
-
16
-
17
-
18
-
19
-
20
-
21
-
22
-
23
-
24
-
 25
25 -
 26
26 -
 27
27 -
 28
28 -
 29
29 -
 30
30 -
 31
31 -
 32
32 -
 33
33 -
 34
34 -
 35
35 -
 36
36 -
 37
37 -
 38
38 -
 39
39 -
 40
40 -
 41
41 -
 42
42 -
 43
43 -
 44
44 -
 45
45 -
46
-
47
-
48
-
49
-
50
-
51
-
52
-
53
-
54
-
55
-
56
-
57
-
58
-
59
-
60
-
61
-
62
-
63
-
64
-
65
-
66
-
67
-
68
-
69
-
70
-
71
-
72
-
73
-
74
-
75
-
76
-
77
-
78
-
79
-
80
-
81
-
82
-
83
-
84
-
85
-
86
-
87
-
88
-
89
-
90
-
91
-
92
-
93
-
94
-
95
-
96
-
97
-
98
 |
 |
33
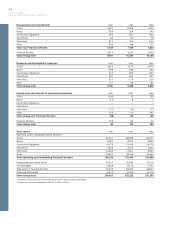
Consolidated balance sheets
SEK M December 31, 2001 December 31, 2002 December 31, 2003
Assets
Non-current assets
Intangible assets Note 12 17,525 17,045 16,756
Tangible assets Note 12
Property, plant and equipment 33,234 30,799 30,640
Assets under operating leases 27,101 60,335 23,525 54,324 21,201 51,841
Financial assets
Shares and participations Note 13 27,798 27,492 1,782
Long-term customer-financing receivables Note 14 26,075 25,207 23,448
Other long-term receivables Note 15 14,456 68,329 12,485 65,184 10,487 35,717
Total non-current assets 146,189 136,553 104,314
Current assets
Inventories Note 16 31,075 28,305 26,459
Short-term receivables
Customer-financing receivables Note 17 22,709 21,791 22,554
Other receivables Note 18 33,569 56,278 26,995 48,786 28,766 51,320
Shares in Scania Note 13 ––20,424
Marketable securities Note 19 13,514 16,707 19,529
Cash and bank accounts Note 20 13,869 8,871 9,206
Total current assets 114,736 102,669 126,938
Total assets 260,925 239,222 231,252
Shareholders’ equity and liabilities
Shareholders’ equity Note 21
Restricted equity
Share capital 2,649 2,649 2,649
Restricted reserves 12,297 14,946 14,093 16,742 12,769 15,418
Unrestricted equity
Unrestricted reserves 71,706 60,143 56,704
Net income (loss) (1,467) 70,239 1,393 61,536 298 57,002
Total shareholders’ equity 85,185 78,278 72,420
Minority interests Note 11 391 247 216
Provisions
Provisions for post-employment benefits Note 22 14,647 16,236 15,288
Provisions for deferred taxes 1,044 912 569
Other provisions Note 23 17,383 33,074 15,809 32,957 14,479 30,336
Non-current liabilities Note 24
Bond loans 30,715 33,870 33,090
Other loans 14,036 12,549 13,584
Other long-term liabilities 9,379 54,130 6,704 53,123 4,627 51,301
Current liabilities Note 25
Loans 36,817 26,018 27,418
Trade payables 23,115 22,214 24,528
Other current liabilities 28,213 88,145 26,385 74,617 25,033 76,979
Total shareholders’ equity and liabilities 260,925 239,222 231,252
Assets pledged Note 26 3,737 3,610 3,809
Contingent liabilities Note 27 10,441 9,334 9,611