Volvo 2003 Annual Report Download - page 6
Download and view the complete annual report
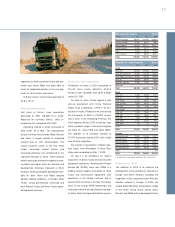
Please find page 6 of the 2003 Volvo annual report below. You can navigate through the pages in the report by either clicking on the pages listed below, or by using the keyword search tool below to find specific information within the annual report.-
 1
1 -
 2
2 -
 3
3 -
 4
4 -
 5
5 -
 6
6 -
 7
7 -
 8
8 -
 9
9 -
 10
10 -
 11
11 -
 12
12 -
 13
13 -
 14
14 -
 15
15 -
 16
16 -
 17
17 -
18
-
19
-
20
-
21
-
22
-
23
-
24
-
25
-
26
-
27
-
28
-
29
-
30
-
31
-
32
-
33
-
34
-
35
-
36
-
37
-
38
-
39
-
40
-
41
-
42
-
43
-
44
-
45
-
46
-
47
-
48
-
49
-
50
-
51
-
52
-
53
-
54
-
55
-
56
-
57
-
58
-
59
-
60
-
61
-
62
-
63
-
64
-
65
-
66
-
67
-
68
-
69
-
70
-
71
-
72
-
73
-
74
-
75
-
76
-
77
-
78
-
79
-
80
-
81
-
82
-
83
-
84
-
85
-
86
-
87
-
88
-
89
-
90
-
91
-
92
-
93
-
94
-
95
-
96
-
97
-
98
 |
 |

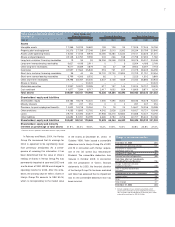
4
The Volvo Group year 2003
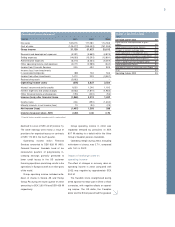
Net sales by market area
SEKM 2001 2002 2003 %1
Western Europe 93,147 92,331 95,775 4
Eastern Europe 6,383 7,437 8,344 12
North America 54,630 50,206 42,043 (16)
South America 6,018 4,667 4,727 1
Asia 10,862 12,644 15,754 25
Other markets 9,575 9,795 8,125 (17)
Volvo Group 180,615 177,080 174,768 (1)
1 Percentage change pertains to 2003/ 2002.
Net sales by business area
SEKM 2001 2002 2003 %1
Trucks 116,568 118,752 116,969 (2)
Buses 16,675 14,035 11,978 (15)
Construction
Equipment 21,135 21,012 23,154 10
Volvo Penta 7,380 7,669 7,596 (1)
Volvo Aero 11,784 8,837 8,030 (9)
Other 7,073 6,775 7,041 4
Volvo Group2180,615 177,080 174,768 (1)
1 Percentage change pertains to 2003/ 2002.
2 Adjusted for changes in currency rates, net sales increased
by 6%
Operating margin 1
%2001 2002 2003
Trucks 0.9 1.0 3.4
Buses (3.1) (0.7) (3.0)
Construction Equipment 4.2 1.9 3.9
Volvo Penta 8.9 8.4 9.1
Volvo Aero 5.5 0.1 (0.5)
Volvo Group11.8 1.6 3.7
Volvo Group (0.4) 1.6 1.4
1Excluding restructuring costs and write-down of shares in
Scania AB and Henlys Group Plc.
Operating income (loss) by business area
SEKM 2001 2002 2003
Trucks 1,040 1,189 3,951
Buses (524) (94) (361)
Construction
Equipment 891 406 908
Volvo Penta 658 647 695
Volvo Aero 653 5 (44)
Financial Services 325 490 926
Other 143 194 459
Operating income13,186 2,837 6,534
Restructuring costs (3,862) – –
Write-down of shares – – (4,030)
Operating income
(loss) (676) 2,837 2,504
1 Excluding restructuring costs and write-down of shares in
Scania AB and Henlys Group Plc.
Financial
performance
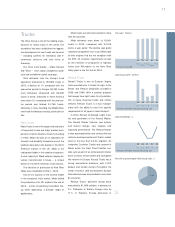
Net sales
Net sales in 2003 amounted to SEK
174,768 M (177,080), a decrease of 1%
compared with the preceding year. Adjusted
for changes in currency exchange rates, net
sales increased by 6%.
Net sales of Volvo’s truck operations
amounted to SEK 116,969 M, an increase of
5% adjusted for changes in currency
exchange rates. The increase in sales related
mainly to higher deliveries in Asia and
Eastern Europe. In North America, deliveries
of trucks were down by 5% and in Western
Europe the Volvo Group's deliveries of trucks
were 4% lower than in the preceding year.
In Buses, net sales decreased 15% com-
pared with 2002. The decline was partly
attributable to currency movements. Ad-
justed for these effects, net sales decreased
8%, pertaining mainly to lower deliveries in
North and South America, partially offset by
favorable volumes in China and the Nordic
countries. In an increasing world market, net
sales of Construction Equipment rose 18%,
adjusted for changes in currency rates, driv-
en by a wider product range and improved
market shares. In Volvo Penta, a weakening
total market was compensated by increased
market shares, and net sales increased by
8%, excluding the impact of currency trans-
lation. Volvo Aero’s net sales rose by 4%,
adjusted for changes in currency rates,
despite the crisis in the airline industry.
The Group’s net sales in Western Europe
increased by 4%. Net sales in North America
were down 16% due to lower USD
exchange rates and lower deliveries of Mack
trucks. Sales in Eastern Europe and Asia
grew by 12% and 25% respectively while
sales in South America increased 1%. The
distribution of net sales by market is further
specified in the adjoining table.
Operating income
Operating income, excluding write-down of
shares, more than doubled in 2003 and
amounted to SEK 6,534 M, compared with
an operating income of SEK 2,837 M in the
preceding year. The improvement was main-
ly attributable to higher margins on newly
introduced products and cost rationalization.
A detailed analysis of changes in the Group's
operating income compared with 2002 is
shown in the table on page 5.
Trucks’ operating income in 2003 amount-
ed to SEK 3,951 M (1,189). The improve-
ment across the three truck brands, Mack,
Renault and Volvo, is largely related to
increased margins due to price realization
and cost rationalization. Earnings improved
in North America, where profitability devel-
oped favorably for both Volvo and Mack
despite adverse market conditions. In
Europe, Volvo Trucks’ strong performance
continued and both Renault Trucks and Volvo
Trucks reported improved earnings.
The operating loss during 2003 in Buses,
excluding write-down of shares, amounted to
SEK 361 M compared with a loss of SEK 94
M in the preceding year. The weaker result
was largely related to lower volumes, contin-
ued price pressure and currency effects.
Construction Equipment reported operating
income of SEK 908 M compared with SEK
406 M in 2002. The improved earnings were
primarily related to increased volumes due to
recently launched products and further
improved market shares partly offset by
strongly negative currency effects.
Operating income in 2003 for Volvo Penta
amounted to SEK 695 M (647). The strong
financial performance of Volvo Penta mainly
related to higher sales and improved gross
margins. In Volvo Aero, operating income