Volvo 2003 Annual Report Download - page 45
Download and view the complete annual report
Please find page 45 of the 2003 Volvo annual report below. You can navigate through the pages in the report by either clicking on the pages listed below, or by using the keyword search tool below to find specific information within the annual report.-
 1
1 -
2
-
3
-
4
-
5
-
6
-
7
-
8
-
9
-
10
-
11
-
12
-
13
-
14
-
15
-
16
-
17
-
18
-
19
-
20
-
21
-
22
-
23
-
24
-
25
-
26
-
27
-
28
-
29
-
30
-
31
-
32
-
33
-
34
-
 35
35 -
 36
36 -
 37
37 -
 38
38 -
 39
39 -
 40
40 -
 41
41 -
 42
42 -
 43
43 -
 44
44 -
 45
45 -
 46
46 -
 47
47 -
 48
48 -
 49
49 -
 50
50 -
 51
51 -
 52
52 -
 53
53 -
 54
54 -
 55
55 -
56
-
57
-
58
-
59
-
60
-
61
-
62
-
63
-
64
-
65
-
66
-
67
-
68
-
69
-
70
-
71
-
72
-
73
-
74
-
75
-
76
-
77
-
78
-
79
-
80
-
81
-
82
-
83
-
84
-
85
-
86
-
87
-
88
-
89
-
90
-
91
-
92
-
93
-
94
-
95
-
96
-
97
-
98
 |
 |

43
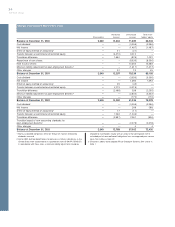
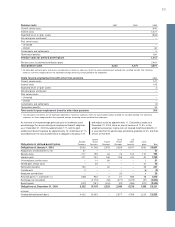
Total shareholders’ equity and liabilities 2001 2002 2003
Operating liabilities, excluding Financial Services: 1
Trucks 56,106 50,481 49,261
Buses 3,511 3,006 2,600
Construction Equipment 3,928 4,079 4,822
Volvo Penta 1,434 1,450 1,460
Volvo Aero 5,291 4,629 3,265
Other 3,093 2,330 3,291
Total operating liabilities excluding Financial Services 73,363 65,975 64,699
Financial liabilities 44,342 38,714 39,940
Tax liabilities 376 770 650
Total liabilities in Financial Services 65,978 61,870 58,838
Other and eliminations (8,710) (6,632) (5,511)
Total liabilities 175,349 160,697 158,616
Shareholders’ equity 85,185 78,278 72,420
Minority interests 391 247 216
Volvo Group total 260,925 239,222 231,252
1 Defined as Total liabilities less financial liabilities and tax liabilities.
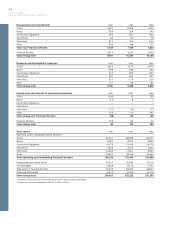
Investments in associated companies 2001 2002 2003
Trucks 513 213 26
Buses 359 296 21
Construction Equipment – – –
Volvo Penta –––
Volvo Aero 51 44 35
Financial Services 165 208 165
Other 879 896 116
Volvo Group total 1,967 1,657 363
Capital expenditures 2001 2002 2003
Trucks 5,949 4,797 4,384
Buses 360 256 161
Construction Equipment 569 660 525
Volvo Penta 199 236 362
Volvo Aero 933 583 262
Other 354 244 528
Volvo Group excl Financial Services 8,364 6,776 6,222
Financial Services 5,775 5,461 5,459
Volvo Group total 14,139 12,237 11,681
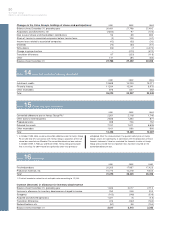
Reporting by geographical segment
Net sales 2001 2002 2003
Europe 104,500 105,069 109,668
North America 57,724 53,438 44,502
South America 6,469 5,070 5,080
Asia 10,887 12,693 15,819
Other markets 9,700 9,928 8,222
Volvo Group total* 189,280 186,198 183,291
*of which:
Sweden 13,615 12,923 14,801
United States 48,407 44,652 36,406
France 26,735 26,387 25,679