Tyson Foods 2011 Annual Report Download - page 79
Download and view the complete annual report
Please find page 79 of the 2011 Tyson Foods annual report below. You can navigate through the pages in the report by either clicking on the pages listed below, or by using the keyword search tool below to find specific information within the annual report.-
 1
1 -
2
-
3
-
4
-
5
-
6
-
7
-
8
-
9
-
10
-
11
-
12
-
13
-
14
-
15
-
16
-
17
-
18
-
19
-
20
-
21
-
22
-
23
-
24
-
25
-
26
-
27
-
28
-
29
-
30
-
31
-
32
-
33
-
34
-
35
-
36
-
37
-
38
-
39
-
40
-
41
-
42
-
43
-
44
-
45
-
46
-
47
-
48
-
49
-
50
-
51
-
52
-
53
-
54
-
55
-
56
-
57
-
58
-
59
-
60
-
61
-
62
-
63
-
64
-
65
-
66
-
67
-
68
-
 69
69 -
 70
70 -
 71
71 -
 72
72 -
 73
73 -
 74
74 -
 75
75 -
 76
76 -
 77
77 -
 78
78 -
 79
79 -
 80
80 -
 81
81 -
 82
82 -
 83
83 -
 84
84 -
 85
85 -
 86
86 -
 87
87 -
 88
88 -
 89
89 -
90
-
91
-
92
 |
 |

79
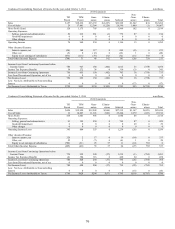
Condensed Consolidating Statement of Cash Flows for the year ended October 2, 2010
in millions
2014 Guarantors
TFI
Parent
TFM
Parent
Guar-
antors
Elimin-
ations
Subtotal
Non-
Guar-
antors
Elimin-
ations
Total
Cash Provided by Operating Activities
$386
$499
$462
$0
$961
$85
$0
$1,432
Cash Flows From Investing Activities:
Additions to property, plant and equipment
(3)
(85)
(323)
0
(408)
(139)
0
(550)
Purchases of marketable securities, net
0
0
0
0
0
(4)
0
(4)
Proceeds from notes receivable
0
0
0
0
0
0
0
0
Proceeds from sale of discontinued operation
0
0
0
0
0
0
0
0
Change in restricted cash-investing
0
0
0
0
0
43
0
43
Acquisitions, net of cash acquired
0
0
0
0
0
0
0
0
Other, net
(1)
(1)
15
0
14
(2)
0
11
Cash Used for Investing Activities
(4)
(86)
(308)
0
(394)
(102)
0
(500)
Cash Flows from Financing Activities:
Net change in debt
(874)
(149)
0
0
(149)
(11)
0
(1,034)
Debt issuance costs
0
0
0
0
0
0
0
0
Purchase of redeemable noncontrolling interest
0
0
0
0
0
0
0
0
Purchases of Tyson Class A common stock
(48)
0
0
0
0
0
0
(48)
Dividends
(59)
0
0
0
0
0
0
(59)
Change in restricted cash-financing
0
0
140
0
140
0
0
140
Other, net
32
0
0
0
0
10
0
42
Net change in intercompany balances
569
(262)
(351)
0
(613)
44
0
0
Cash Provided by (Used for) Financing Activities
(380)
(411)
(211)
0
(622)
43
0
(959)
Effect of Exchange Rate Change on Cash
0
0
0
0
0
1
0
1
Increase (Decrease) in Cash and Cash Equivalents
2
2
(57)
0
(55)
27
0
(26)
Cash and Cash Equivalents at Beginning of Year
0
0
788
0
788
216
0
1,004
Cash and Cash Equivalents at End of Year
$2
$2
$731
$0
$733
$243
$0
$978
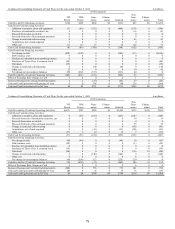
Condensed Consolidating Statement of Cash Flows for the year ended October 3, 2009
in millions
2014 Guarantors
TFI
Parent
TFM
Parent
Guar-
antors
Elimin-
ations
Subtotal
Non-
Guar-
antors
Elimin-
ations
Total
Cash Provided by (Used for) Operating Activities
$(617)
$507
$982
$0
$1,489
$113
$(25)
$960
Cash Flows From Investing Activities:
Additions to property, plant and equipment
0
(56)
(211)
0
(267)
(101)
0
(368)
Proceeds from sale of marketable securities, net
0
0
0
0
0
19
0
19
Proceeds from notes receivable
0
0
0
0
0
0
0
0
Proceeds from sale of discontinued operation
0
0
0
0
0
75
0
75
Change in restricted cash-investing
0
0
0
0
0
(43)
0
(43)
Acquisitions, net of cash acquired
0
0
(13)
0
(13)
(80)
0
(93)
Other, net
(37)
1
12
0
13
7
0
(17)
Cash Used for Investing Activities
(37)
(55)
(212)
0
(267)
(123)
0
(427)
Cash Flows from Financing Activities:
Net change in debt
545
(94)
0
0
(94)
36
0
487
Debt issuance costs
(58)
0
0
0
0
(1)
0
(59)
Purchase of redeemable noncontrolling interest
0
0
0
0
0
0
0
0
Purchases of Tyson Class A common stock
(19)
0
0
0
0
0
0
(19)
Dividends
(60)
0
0
0
0
(25)
25
(60)
Change in restricted cash-financing
0
0
(140)
0
(140)
0
0
(140)
Other, net
0
0
0
0
0
6
0
6
Net change in intercompany balances
106
(358)
123
0
(235)
129
0
0
Cash Provided by (Used for) Financing Activities
514
(452)
(17)
0
(469)
145
25
215
Effect of Exchange Rate Change on Cash
0
0
0
0
0
6
0
6
Increase (Decrease) in Cash and Cash Equivalents
(140)
0
753
0
753
141
0
754
Cash and Cash Equivalents at Beginning of Year
140
0
35
0
35
75
0
250
Cash and Cash Equivalents at End of Year
$0
$0
$788
$0
$788
$216
$0
$1,004