Tyson Foods 2011 Annual Report Download - page 64
Download and view the complete annual report
Please find page 64 of the 2011 Tyson Foods annual report below. You can navigate through the pages in the report by either clicking on the pages listed below, or by using the keyword search tool below to find specific information within the annual report.-
 1
1 -
2
-
3
-
4
-
5
-
6
-
7
-
8
-
9
-
10
-
11
-
12
-
13
-
14
-
15
-
16
-
17
-
18
-
19
-
20
-
21
-
22
-
23
-
24
-
25
-
26
-
27
-
28
-
29
-
30
-
31
-
32
-
33
-
34
-
35
-
36
-
37
-
38
-
39
-
40
-
41
-
42
-
43
-
44
-
45
-
46
-
47
-
48
-
49
-
50
-
51
-
52
-
53
-
 54
54 -
 55
55 -
 56
56 -
 57
57 -
 58
58 -
 59
59 -
 60
60 -
 61
61 -
 62
62 -
 63
63 -
 64
64 -
 65
65 -
 66
66 -
 67
67 -
 68
68 -
 69
69 -
 70
70 -
 71
71 -
 72
72 -
 73
73 -
 74
74 -
75
-
76
-
77
-
78
-
79
-
80
-
81
-
82
-
83
-
84
-
85
-
86
-
87
-
88
-
89
-
90
-
91
-
92
 |
 |

64
We recognized stock-based compensation expense related to restricted stock, net of income taxes, of $7 million, $8 million and $10
million for years 2011, 2010 and 2009, respectively. The related tax benefit for fiscal years 2011, 2010 and 2009 was $5 million, $5
million and $7 million, respectively. We had 0.9 million, 1.8 million and 0.7 million, respectively, restricted stock awards vest in
fiscal years 2011, 2010 and 2009, with a grant date fair value of $14 million, $30 million and $11 million.
Performance-Based Shares
In July 2003, our Compensation Committee began authorizing us to award performance-based shares of our Class A stock to certain
senior executives. These awards are typically granted on the first business day of our fiscal year. The vesting of the performance-based
shares is generally over three years and each award is subject to the attainment of goals determined by the Compensation Committee
prior to the date of the award. We review progress toward the attainment of goals each quarter during the vesting period. However, the
attainment of goals can be determined only at the end of the vesting period. If the shares vest, the ultimate cost will be equal to the
Class A stock price on the date the shares vest multiplied by the number of shares awarded for all performance grants with other than
market criteria. For grants with market performance criteria, the ultimate expense will be the fair value of the probable shares to vest
regardless if the shares actually vest. Total expense recorded related to performance-based shares was not material for fiscal 2011,
2010 and 2009.
NOTE 14: PENSIONS AND OTHER POSTRETIREMENT BENEFITS
At October 1, 2011, we had four noncontributory defined benefit pension plans consisting of three funded qualified plans and one
unfunded non-qualified plan. All three of our qualified plans are frozen and provide benefits based on a formula using years of service
and a specified benefit rate. Effective January 1, 2004, we implemented a non-qualified defined benefit plan for certain contracted
officers that uses a formula based on years of service and final average salary. We also have other postretirement benefit plans for
which substantially all of our employees may receive benefits if they satisfy applicable eligibility criteria. The postretirement
healthcare plans are contributory with participants’ contributions adjusted when deemed necessary.
We have defined contribution retirement and incentive benefit programs for various groups of employees. We recognized expenses of
$45 million, $48 million and $49 million in fiscal 2011, 2010 and 2009, respectively.
We use a fiscal year end measurement date for our defined benefit plans and other postretirement plans. We generally recognize the
effect of actuarial gains and losses into earnings immediately for other postretirement plans rather than amortizing the effect over
future periods.
Other postretirement benefits include postretirement medical costs and life insurance.
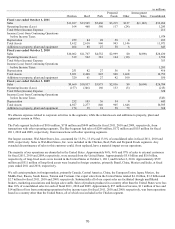
Benefit Obligations And Funded Status
The following table provides a reconciliation of the changes in the plans’ benefit obligations, assets and funded status at October 1,
2011, and October 2, 2010:
in millions
Pension Benefits
Other Postretirement
Qualified
Non-Qualified
Benefits
2011
2010
2011
2010
2011
2010
Change in benefit obligation
Benefit obligation at beginning of year
$97
$89
$42
$38
$45
$46
Service cost
0
0
3
3
0
1
Interest cost
5
5
2
2
2
2
Plan participants’ contributions
0
0
0
0
1
1
Actuarial loss
3
9
17
0
4
1
Benefits paid
(6)
(6)
(2)
(1)
(8)
(6)
Benefit obligation at end of year
99
97
62
42
44
45
Change in plan assets
Fair value of plan assets at beginning of year
74
68
0
0
0
0
Actual return on plan assets
1
9
0
0
0
0
Employer contributions
5
3
2
1
7
5
Plan participants’ contributions
0
0
0
0
1
1
Benefits paid
(6)
(6)
(2)
(1)
(8)
(6)
Fair value of plan assets at end of year
74
74
0
0
0
0
Funded status
$(25)
$(23)
$(62)
$(42)
$(44)
$(45)