Tyson Foods 2011 Annual Report Download - page 76
Download and view the complete annual report
Please find page 76 of the 2011 Tyson Foods annual report below. You can navigate through the pages in the report by either clicking on the pages listed below, or by using the keyword search tool below to find specific information within the annual report.-
 1
1 -
2
-
3
-
4
-
5
-
6
-
7
-
8
-
9
-
10
-
11
-
12
-
13
-
14
-
15
-
16
-
17
-
18
-
19
-
20
-
21
-
22
-
23
-
24
-
25
-
26
-
27
-
28
-
29
-
30
-
31
-
32
-
33
-
34
-
35
-
36
-
37
-
38
-
39
-
40
-
41
-
42
-
43
-
44
-
45
-
46
-
47
-
48
-
49
-
50
-
51
-
52
-
53
-
54
-
55
-
56
-
57
-
58
-
59
-
60
-
61
-
62
-
63
-
64
-
65
-
 66
66 -
 67
67 -
 68
68 -
 69
69 -
 70
70 -
 71
71 -
 72
72 -
 73
73 -
 74
74 -
 75
75 -
 76
76 -
 77
77 -
 78
78 -
 79
79 -
 80
80 -
 81
81 -
 82
82 -
 83
83 -
 84
84 -
 85
85 -
 86
86 -
87
-
88
-
89
-
90
-
91
-
92
 |
 |

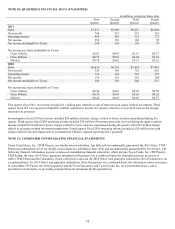
76
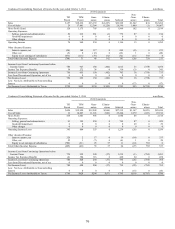
Condensed Consolidating Statement of Income for the year ended October 1, 2011
in millions
2014 Guarantors
TFI
Parent
TFM
Parent
Guar-
antors
Elimin-
ations
Subtotal
Non-
Guar-
antors
Elimin-
ations
Total
Sales
$157
$18,636
$13,159
$(1,227)
$30,568
$1,542
$(1)
$32,266
Cost of Sales
29
17,461
12,364
(1,226)
28,599
1,440
(1)
30,067
Gross Profit (Loss)
128
1,175
795
(1)
1,969
102
0
2,199
Operating Expenses:
Selling, general and administrative
52
215
561
(1)
775
87
0
914
Goodwill impairment
0
0
0
0
0
0
0
0
Other charges
0
0
0
0
0
0
0
0
Operating Income
76
960
234
0
1,194
15
0
1,285
Other (Income) Expense:
Interest expense, net
(26)
148
117
0
265
(8)
0
231
Other, net
(9)
0
(12)
0
(12)
1
0
(20)
Equity in net earnings of subsidiaries
(673)
(115)
(59)
102
(72)
(13)
758
0
Total Other (Income) Expense
(708)
33
46
102
181
(20)
758
211
Income (Loss) from Continuing Operations before
Income Taxes
784
927
188
(102)
1,013
35
(758)
1,074
Income Tax Expense (Benefit)
34
272
38
0
310
(3)
0
341
Income (Loss) from Continuing Operations
750
655
150
(102)
703
38
(758)
733
Loss from Discontinued Operation, net of tax
0
0
0
0
0
0
0
0
Net Income (Loss)
750
655
150
(102)
703
38
(758)
733
Less: Net Loss Attributable to Noncontrolling
Interest
0
0
0
0
0
(17)
0
(17)
Net Income (Loss) Attributable to Tyson
$750
$655
$150
$(102)
$703
$55
$(758)
$750
Condensed Consolidating Statement of Income for the year ended October 2, 2010
in millions
2014 Guarantors
TFI
Parent
TFM
Parent
Guar-
antors
Elimin-
ations
Subtotal
Non-
Guar-
antors
Elimin-
ations
Total
Sales
$454
$15,950
$12,248
$(966)
$27,232
$1,167
$(423)
$28,430
Cost of Sales
16
14,867
11,343
(966)
25,244
1,079
(423)
25,916
Gross Profit
438
1,083
905
0
1,988
88
0
2,514
Operating Expenses:
Selling, general and administrative
93
199
550
0
749
87
0
929
Goodwill impairment
0
0
0
0
0
29
0
29
Other charges
0
0
0
0
0
0
0
0
Operating Income (Loss)
345
884
355
0
1,239
(28)
0
1,556
Other (Income) Expense:
Interest expense, net
328
2
17
0
19
(14)
0
333
Other, net
25
1
(7)
0
(6)
1
0
20
Equity in net earnings of subsidiaries
(782)
(51)
25
37
11
(14)
785
0
Total Other (Income) Expense
(429)
(48)
35
37
24
(27)
785
353
Income (Loss) from Continuing Operations before
Income Taxes
774
932
320
(37)
1,215
(1)
(785)
1,203
Income Tax Expense (Benefit)
(6)
304
116
0
420
24
0
438
Income (Loss) from Continuing Operations
780
628
204
(37)
795
(25)
(785)
765
Loss from Discontinued Operation, net of tax
0
0
0
0
0
0
0
0
Net Income (Loss)
780
628
204
(37)
795
(25)
(785)
765
Less: Net Loss Attributable to Noncontrolling
Interest
0
0
0
0
0
(15)
0
(15)
Net Income (Loss) Attributable to Tyson
$780
$628
$204
$(37)
$795
$(10)
$(785)
$780