Tyson Foods 2011 Annual Report Download - page 65
Download and view the complete annual report
Please find page 65 of the 2011 Tyson Foods annual report below. You can navigate through the pages in the report by either clicking on the pages listed below, or by using the keyword search tool below to find specific information within the annual report.-
 1
1 -
2
-
3
-
4
-
5
-
6
-
7
-
8
-
9
-
10
-
11
-
12
-
13
-
14
-
15
-
16
-
17
-
18
-
19
-
20
-
21
-
22
-
23
-
24
-
25
-
26
-
27
-
28
-
29
-
30
-
31
-
32
-
33
-
34
-
35
-
36
-
37
-
38
-
39
-
40
-
41
-
42
-
43
-
44
-
45
-
46
-
47
-
48
-
49
-
50
-
51
-
52
-
53
-
54
-
 55
55 -
 56
56 -
 57
57 -
 58
58 -
 59
59 -
 60
60 -
 61
61 -
 62
62 -
 63
63 -
 64
64 -
 65
65 -
 66
66 -
 67
67 -
 68
68 -
 69
69 -
 70
70 -
 71
71 -
 72
72 -
 73
73 -
 74
74 -
 75
75 -
76
-
77
-
78
-
79
-
80
-
81
-
82
-
83
-
84
-
85
-
86
-
87
-
88
-
89
-
90
-
91
-
92
 |
 |

65
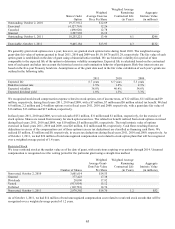
Amounts recognized in the Consolidated Balance Sheets consist of:
in millions
Pension Benefits
Other Postretirement
Qualified
Non-Qualified
Benefits
2011
2010
2011
2010
2011
2010
Accrued benefit liability
$(25)
$(23)
$(62)
$(42)
$(44)
$(45)
Accumulated other comprehensive
(income)/loss:
Unrecognized actuarial loss
45
40
17
1
0
0
Unrecognized prior service (cost)/credit
0
0
2
3
(5)
(6)
Net amount recognized
$20
$17
$(43)
$(38)
$(49)
$(51)
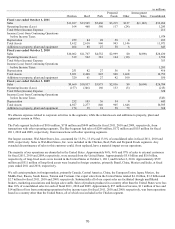
At October 1, 2011, and October 2, 2010, all pension plans had an accumulated benefit obligation in excess of plan assets. The
accumulated benefit obligation for all qualified pension plans was $99 million and $97 million at October 1, 2011, and October 2,
2010, respectively. Plans with accumulated benefit obligations in excess of plan assets are as follows:
in millions
Pension Benefits
Qualified
Non-Qualified
2011
2010
2011
2010
Projected benefit obligation
$99
$97
$62
$42
Accumulated benefit obligation
99
97
55
41
Fair value of plan assets
74
74
0
0
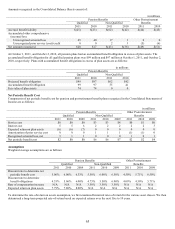
Net Periodic Benefit Cost
Components of net periodic benefit cost for pension and postretirement benefit plans recognized in the Consolidated Statements of
Income are as follows:
in millions
Pension Benefits
Other Postretirement
Qualified
Non-Qualified
Benefits
2011
2010
2009
2011
2010
2009
2011
2010
2009
Service cost
$0
$0
$0
$3
$3
$4
$0
$1
$0
Interest cost
5
5
6
2
2
2
2
2
3
Expected return on plan assets
(6)
(6)
(7)
0
0
0
0
0
0
Amortization of prior service cost
0
0
0
1
1
1
(1)
(1)
0
Recognized actuarial loss, net
3
1
1
0
0
0
1
0
1
Net periodic benefit cost
$2
$0
$0
$6
$6
$7
$2
$2
$4
Assumptions
Weighted average assumptions are as follows:
Pension Benefits
Other Postretirement
Qualified
Non-Qualified
Benefits
2011
2010
2009
2011
2010
2009
2011
2010
2009
Discount rate to determine net
periodic benefit cost
5.06%
6.00%
6.33%
5.50%
6.00%
6.50%
4.50%
5.71%
6.50%
Discount rate to determine
benefit obligations
4.53%
5.06%
6.00%
4.75%
5.50%
6.00%
4.09%
4.50%
5.71%
Rate of compensation increase
N/A
N/A
N/A
3.50%
3.50%
3.50%
N/A
N/A
N/A
Expected return on plan assets
7.79%
7.80%
8.00%
N/A
N/A
N/A
N/A
N/A
N/A
To determine the rate-of-return on assets assumption, we first examined historical rates of return for the various asset classes. We then
determined a long-term projected rate-of-return based on expected returns over the next five to 10 years.