Tyson Foods 2011 Annual Report Download - page 55
Download and view the complete annual report
Please find page 55 of the 2011 Tyson Foods annual report below. You can navigate through the pages in the report by either clicking on the pages listed below, or by using the keyword search tool below to find specific information within the annual report.-
 1
1 -
2
-
3
-
4
-
5
-
6
-
7
-
8
-
9
-
10
-
11
-
12
-
13
-
14
-
15
-
16
-
17
-
18
-
19
-
20
-
21
-
22
-
23
-
24
-
25
-
26
-
27
-
28
-
29
-
30
-
31
-
32
-
33
-
34
-
35
-
36
-
37
-
38
-
39
-
40
-
41
-
42
-
43
-
44
-
 45
45 -
 46
46 -
 47
47 -
 48
48 -
 49
49 -
 50
50 -
 51
51 -
 52
52 -
 53
53 -
 54
54 -
 55
55 -
 56
56 -
 57
57 -
 58
58 -
 59
59 -
 60
60 -
 61
61 -
 62
62 -
 63
63 -
 64
64 -
 65
65 -
66
-
67
-
68
-
69
-
70
-
71
-
72
-
73
-
74
-
75
-
76
-
77
-
78
-
79
-
80
-
81
-
82
-
83
-
84
-
85
-
86
-
87
-
88
-
89
-
90
-
91
-
92
 |
 |

55
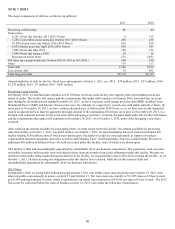
NOTE 10: EARNINGS (LOSS) PER SHARE
The earnings and weighted average common shares used in the computation of basic and diluted earnings (loss) per share are as
follows:
in millions, except per share data
2011
2010
2009
Numerator:
Income (loss) from continuing operations
$733
$765
$(550)
Less: Net loss attributable to noncontrolling interest
(17)
(15)
(4)
Income (loss) from continuing operations attributable to Tyson
750
780
(546)
Less Dividends:
Class A ($0.16/share)
49
49
50
Class B ($0.144/share)
10
10
10
Undistributed earnings (losses)
$691
$721
$(606)
Class A undistributed earnings (losses)
$572
$597
$(501)
Class B undistributed earnings (losses)
119
124
(105)
Total undistributed earnings (losses)
$691
$721
$(606)
Denominator:
Denominator for basic earnings (loss) per share:
Class A weighted average shares
303
303
302
Class B weighted average shares, and shares under if-converted
method for diluted earnings per share
70
70
70
Effect of dilutive securities:
Stock options and restricted stock
6
6
0
Convertible 2013 Notes
1
0
0
Denominator for diluted earnings (loss) per share – adjusted
weighted average shares and assumed conversions
380
379
372
Net Income (Loss) Per Share from Continuing Operations
Attributable to Tyson:
Class A Basic
$2.04
$2.13
$(1.49)
Class B Basic
$1.84
$1.91
$(1.35)
Diluted
$1.97
$2.06
$(1.47)
Net Income (Loss) Per Share Attributable to Tyson:
Class A Basic
$2.04
$2.13
$(1.49)
Class B Basic
$1.84
$1.91
$(1.35)
Diluted
$1.97
$2.06
$(1.47)
Approximately 4 million, 5 million and 24 million in fiscal years 2011, 2010 and 2009, respectively, of our stock-based compensation
shares were antidilutive and were not included in the dilutive earnings per share calculation.
We have two classes of capital stock, Class A stock and Class B stock. Cash dividends cannot be paid to holders of Class B stock
unless they are simultaneously paid to holders of Class A stock. The per share amount of cash dividends paid to holders of Class B
stock cannot exceed 90% of the cash dividends paid to holders of Class A stock.
We allocate undistributed earnings (losses) based upon a 1 to 0.9 ratio per share to Class A stock and Class B stock, respectively. We
allocate undistributed earnings (losses) based on this ratio due to historical dividend patterns, voting control of Class B shareholders
and contractual limitations of dividends to Class B stock.