Tyson Foods 2011 Annual Report Download - page 63
Download and view the complete annual report
Please find page 63 of the 2011 Tyson Foods annual report below. You can navigate through the pages in the report by either clicking on the pages listed below, or by using the keyword search tool below to find specific information within the annual report.-
 1
1 -
2
-
3
-
4
-
5
-
6
-
7
-
8
-
9
-
10
-
11
-
12
-
13
-
14
-
15
-
16
-
17
-
18
-
19
-
20
-
21
-
22
-
23
-
24
-
25
-
26
-
27
-
28
-
29
-
30
-
31
-
32
-
33
-
34
-
35
-
36
-
37
-
38
-
39
-
40
-
41
-
42
-
43
-
44
-
45
-
46
-
47
-
48
-
49
-
50
-
51
-
52
-
 53
53 -
 54
54 -
 55
55 -
 56
56 -
 57
57 -
 58
58 -
 59
59 -
 60
60 -
 61
61 -
 62
62 -
 63
63 -
 64
64 -
 65
65 -
 66
66 -
 67
67 -
 68
68 -
 69
69 -
 70
70 -
 71
71 -
 72
72 -
 73
73 -
74
-
75
-
76
-
77
-
78
-
79
-
80
-
81
-
82
-
83
-
84
-
85
-
86
-
87
-
88
-
89
-
90
-
91
-
92
 |
 |
63
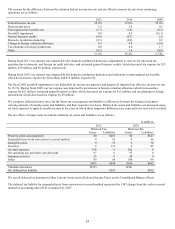
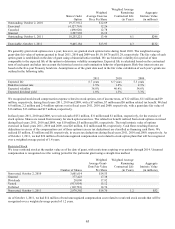
Shares Under
Option
Weighted
Average Exercise
Price Per Share
Weighted Average
Remaining
Contractual Life
(in Years)
Aggregate
Intrinsic Value
(in millions)
Outstanding, October 2, 2010
19,373,912
$12.69
Exercised
(4,127,763)
12.26
Canceled
(498,920)
12.78
Granted
3,507,992
16.19
Outstanding, October 1, 2011
18,255,221
13.46
6.1
$246
Exercisable, October 1, 2011
9,465,184
$13.93
4.3
$132
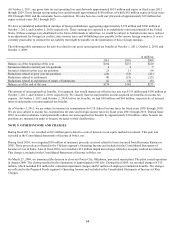
We generally grant stock options once a year; however, we granted stock options twice during fiscal 2010. The weighted average
grant-date fair value of options granted in fiscal 2011, 2010 and 2009 was $6.19, $4.76 and $1.29, respectively. The fair value of each
option grant is established on the date of grant using a binomial lattice method. We use historical volatility for a period of time
comparable to the expected life of the option to determine volatility assumptions. Expected life is calculated based on the contractual
term of each grant and takes into account the historical exercise and termination behavior of participants. Risk-free interest rates are
based on the five-year Treasury bond rate. Assumptions as of the grant date used in the fair value calculation of each year’s grants are
outlined in the following table.
2011
2010
2009
Expected life
6.7 years
6.5 years
5.3 years
Risk-free interest rate
1.5%
1.2%
2.3%
Expected volatility
38.8%
40.4%
34.6%
Expected dividend yield
1.0%
1.3%
3.3%
We recognized stock-based compensation expense related to stock options, net of income taxes, of $12 million, $11 million and $9
million, respectively, during fiscal years 2011, 2010 and 2009, with a $7 million, $7 million and $6 million related tax benefit. We had
6.8 million, 2.2 million and 2.4 million options vest in fiscal years 2011, 2010 and 2009, respectively, with a grant date fair value of
$16 million, $13 million and $15 million, respectively.
In fiscal years 2011, 2010 and 2009, we received cash of $51 million, $31 million and $1 million, respectively, for the exercise of
stock options. Shares are issued from treasury for stock option exercises. The related tax benefit realized from stock options exercised
during fiscal years 2011, 2010 and 2009, was $10 million, $5 million and $0, respectively. The total intrinsic value of options
exercised in fiscal years 2011, 2010 and 2009, was $26 million, $12 million and $0, respectively. Cash flows resulting from tax
deductions in excess of the compensation cost of those options (excess tax deductions) are classified as financing cash flows. We
realized $5 million, $3 million and $0, respectively, in excess tax deductions during fiscal years 2011, 2010 and 2009, respectively. As
of October 1, 2011, we had $26 million of total unrecognized compensation cost related to stock option plans that will be recognized
over a weighted average period of 1.4 years.
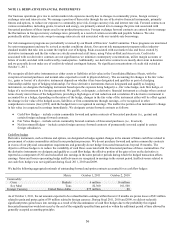
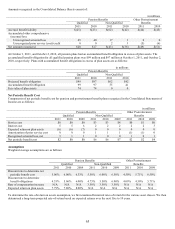
Restricted Stock
We issue restricted stock at the market value as of the date of grant, with restrictions expiring over periods through 2014. Unearned
compensation is recognized over the vesting period for the particular grant using a straight-line method.
Number of Shares
Weighted
Average
Grant-
Date Fair Value
Per Share
Weighted Average
Remaining
Contractual Life
(in Years)
Aggregate
Intrinsic Value
(in millions)
Nonvested, October 2, 2010
3,601,614
$14.55
Granted
377,423
17.38
Dividends
28,000
17.92
Vested
(913,954)
15.12
Forfeited
(122,781)
14.74
Nonvested, October 1, 2011
2,970,302
$14.70
1.2
$52
As of October 1, 2011, we had $14 million of total unrecognized compensation cost related to restricted stock awards that will be
recognized over a weighted average period of 1.2 years.