Tyson Foods 2011 Annual Report Download - page 27
Download and view the complete annual report
Please find page 27 of the 2011 Tyson Foods annual report below. You can navigate through the pages in the report by either clicking on the pages listed below, or by using the keyword search tool below to find specific information within the annual report.-
 1
1 -
2
-
3
-
4
-
5
-
6
-
7
-
8
-
9
-
10
-
11
-
12
-
13
-
14
-
15
-
16
-
 17
17 -
 18
18 -
 19
19 -
 20
20 -
 21
21 -
 22
22 -
 23
23 -
 24
24 -
 25
25 -
 26
26 -
 27
27 -
 28
28 -
 29
29 -
 30
30 -
 31
31 -
 32
32 -
 33
33 -
 34
34 -
 35
35 -
 36
36 -
 37
37 -
38
-
39
-
40
-
41
-
42
-
43
-
44
-
45
-
46
-
47
-
48
-
49
-
50
-
51
-
52
-
53
-
54
-
55
-
56
-
57
-
58
-
59
-
60
-
61
-
62
-
63
-
64
-
65
-
66
-
67
-
68
-
69
-
70
-
71
-
72
-
73
-
74
-
75
-
76
-
77
-
78
-
79
-
80
-
81
-
82
-
83
-
84
-
85
-
86
-
87
-
88
-
89
-
90
-
91
-
92
 |
 |

27
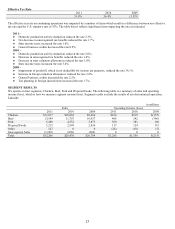
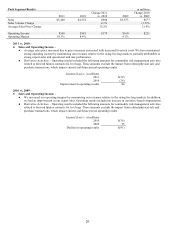
Prepared Foods Segment Results
in millions
2011
2010
Change 2011
vs. 2010
2009
Change 2010
vs. 2009
Sales
$3,215
$2,999
$216
$2,836
$163
Sales Volume Change
(2.2)%
0.3%
Average Sales Price Change
9.6%
5.5%
Operating Income
$117
$124
$(7)
$133
$(9)
Operating Margin
3.6%
4.1%
4.7%
2009 – Operating income included a $15 million charge related to closing our Ponca City, Oklahoma, processed meats plant.
2011 vs. 2010 –
●
Sales and Operating Income – Despite the increase in average sales prices, operating income remained flat, excluding $8
million in insurance proceeds in fiscal 2010 related to flood damage at our Jefferson, Wisconsin plant. The increase in
average sales prices were offset by lower volumes, increased raw material costs of $273 million and increased operational
costs of $50 million, primarily attributable to employee related costs and plant variances mostly due to lower volumes.
2010 vs. 2009 –
●
Sales and Operating Income – Despite the increase in average sales prices and sales volume, operating income declined
in fiscal 2010 as compared to fiscal 2009 due to an increase in raw material costs. However, we made several operational
improvements in late fiscal 2009 that allow us to run our plants more efficiently. Operating results included an increase in
incentive-based compensation.
LIQUIDITY AND CAPITAL RESOURCES
Our cash needs for working capital, capital expenditures, growth opportunities, the repurchases of senior notes and share repurchases
are expected to be met with current cash on hand, cash flows provided by operating activities, or short-term borrowings. Based on our
current expectations, we believe our liquidity and capital resources will be sufficient to operate our business. However, we may take
advantage of opportunities to generate additional liquidity or refinance existing debt through capital market transactions. The amount,
nature and timing of any capital market transactions will depend on: our operating performance and other circumstances; our then-
current commitments and obligations; the amount, nature and timing of our capital requirements; any limitations imposed by our
current credit arrangements; and overall market conditions.
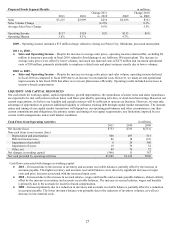
Cash Flows from Operating Activities
in millions
2011
2010
2009
Net income (loss)
$733
$765
$(551)
Non-cash items in net income (loss):
Depreciation and amortization
506
497
513
Deferred income taxes
86
18
(33)
Impairment of goodwill
0
29
560
Impairment of assets
18
36
32
Other, net
49
76
72
Net changes in working capital
(346)
11
367
Net cash provided by operating activities
$1,046
$1,432
$960
Cash flows associated with changes in working capital:
●
2011 – Decreased due to the increase in inventory and accounts receivable balances, partially offset by the increase in
accounts payable.
The higher inventory and accounts receivable balances were driven by significant increases in input
costs and price increases associated with the increased input costs.
●
2010 – Increased due to the increase in accrued salaries, wages and benefits and accounts payable balances, almost entirely
offset by the increase in inventory and accounts receivable balances. The increase in accrued salaries, wages and benefits
is primarily due to the accruals for incentive-based compensation.
●
2009 – Increased primarily due to a reduction in inventory and accounts receivable balances, partially offset by a reduction
in accounts payable. The lower inventory balance was primarily due to the reduction of inventory volumes, as well as a
decrease in raw material costs.