Tyson Foods 2011 Annual Report Download - page 53
Download and view the complete annual report
Please find page 53 of the 2011 Tyson Foods annual report below. You can navigate through the pages in the report by either clicking on the pages listed below, or by using the keyword search tool below to find specific information within the annual report.-
 1
1 -
2
-
3
-
4
-
5
-
6
-
7
-
8
-
9
-
10
-
11
-
12
-
13
-
14
-
15
-
16
-
17
-
18
-
19
-
20
-
21
-
22
-
23
-
24
-
25
-
26
-
27
-
28
-
29
-
30
-
31
-
32
-
33
-
34
-
35
-
36
-
37
-
38
-
39
-
40
-
41
-
42
-
 43
43 -
 44
44 -
 45
45 -
 46
46 -
 47
47 -
 48
48 -
 49
49 -
 50
50 -
 51
51 -
 52
52 -
 53
53 -
 54
54 -
 55
55 -
 56
56 -
 57
57 -
 58
58 -
 59
59 -
 60
60 -
 61
61 -
 62
62 -
 63
63 -
64
-
65
-
66
-
67
-
68
-
69
-
70
-
71
-
72
-
73
-
74
-
75
-
76
-
77
-
78
-
79
-
80
-
81
-
82
-
83
-
84
-
85
-
86
-
87
-
88
-
89
-
90
-
91
-
92
 |
 |

53
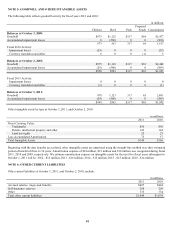
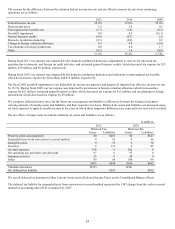
The reasons for the difference between the statutory federal income tax rate and our effective income tax rate from continuing
operations are as follows:
2011
2010
2009
Federal income tax rate
35.0%
35.0%
35.0%
State income taxes
1.6
2.4
0.1
Unrecognized tax benefits, net
(1.7)
(1.4)
(0.3)
Goodwill impairment
0.0
0.9
(36.1)
General business credits
(0.9)
(0.7)
2.2
Domestic production deduction
(2.3)
(2.0)
0.5
Change in foreign valuation allowance
0.3
0.8
(3.8)
Tax planning in foreign jurisdictions
0.0
0.0
1.7
Other
(0.2)
1.4
(0.8)
31.8%
36.4%
(1.5)%
During fiscal 2011, tax expense was impacted by the domestic production deduction, adjustments to reserves for uncertain tax
positions due to domestic and foreign tax audit activities, and estimated general business credits, which decreased tax expense by $25
million, $19 million, and $9 million, respectively.
During fiscal 2010, tax expense was impacted by the domestic production deduction and reductions in unrecognized tax benefits,
which decreased tax expense by $24 million and $16 million, respectively.
The fiscal 2009 goodwill impairment is not deductible for income tax purposes and negatively impacted our effective income tax rate
by 36.1%. During fiscal 2009, our tax expense was impacted by an increase in foreign valuation allowance which increased tax
expense by $21 million, estimated general business credits, which decreased tax expense by $12 million, and tax planning in foreign
jurisdictions which decreased tax expense by $9 million.
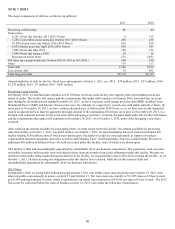
We recognize deferred income taxes for the future tax consequences attributable to differences between the financial statement
carrying amounts of existing assets and liabilities and their respective tax bases. Deferred tax assets and liabilities are measured using
tax rates expected to apply to taxable income in the years in which those temporary differences are expected to be recovered or settled.
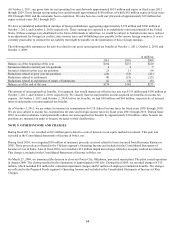
The tax effects of major items recorded as deferred tax assets and liabilities are as follows:
in millions
2011
2010
Deferred Tax
Deferred Tax
Assets
Liabilities
Assets
Liabilities
Property, plant and equipment
$0
$401
$0
$347
Suspended taxes from conversion to accrual method
0
81
0
86
Intangible assets
0
35
0
34
Inventory
9
113
9
85
Accrued expenses
196
0
202
0
Net operating loss and other carryforwards
97
0
97
0
Insurance reserves
23
0
20
0
Other
80
68
108
90
$405
$698
$436
$642
Valuation allowance
$(92)
$(96)
Net deferred tax liability
$385
$302
We record deferred tax amounts in Other Current Assets and in Deferred Income Taxes on the Consolidated Balance Sheets.
The deferred tax liability for suspended taxes from conversion to accrual method represents the 1987 change from the cash to accrual
method of accounting and will be recognized by 2027.