Tyson Foods 2011 Annual Report Download - page 66
Download and view the complete annual report
Please find page 66 of the 2011 Tyson Foods annual report below. You can navigate through the pages in the report by either clicking on the pages listed below, or by using the keyword search tool below to find specific information within the annual report.-
 1
1 -
2
-
3
-
4
-
5
-
6
-
7
-
8
-
9
-
10
-
11
-
12
-
13
-
14
-
15
-
16
-
17
-
18
-
19
-
20
-
21
-
22
-
23
-
24
-
25
-
26
-
27
-
28
-
29
-
30
-
31
-
32
-
33
-
34
-
35
-
36
-
37
-
38
-
39
-
40
-
41
-
42
-
43
-
44
-
45
-
46
-
47
-
48
-
49
-
50
-
51
-
52
-
53
-
54
-
55
-
 56
56 -
 57
57 -
 58
58 -
 59
59 -
 60
60 -
 61
61 -
 62
62 -
 63
63 -
 64
64 -
 65
65 -
 66
66 -
 67
67 -
 68
68 -
 69
69 -
 70
70 -
 71
71 -
 72
72 -
 73
73 -
 74
74 -
 75
75 -
 76
76 -
77
-
78
-
79
-
80
-
81
-
82
-
83
-
84
-
85
-
86
-
87
-
88
-
89
-
90
-
91
-
92
 |
 |

66
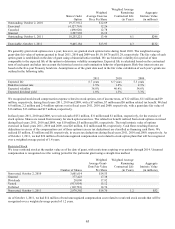
Our discount rate assumptions used to account for pension and other postretirement benefit plans reflect the rates at which the benefit
obligations could be effectively settled. These were determined using a cash flow matching technique whereby the rates of a yield
curve, developed from high-quality debt securities, were applied to the benefit obligations to determine the appropriate discount rate.
We have three postretirement health plans. Two of these consist of fixed, annual payments and account for $28 million of the
postretirement medical obligation at October 1, 2011. A healthcare cost trend is not required to determine this obligation. The
remaining plan accounts for $16 million of the postretirement medical obligation at October 1, 2011. The plan covers retirees who do
not yet qualify for Medicare and uses a healthcare cost trend of 6% in the current year. A one-percentage point change in assumed
healthcare cost trend rate would have an immaterial impact on the postretirement benefit obligation and total service and interest cost.
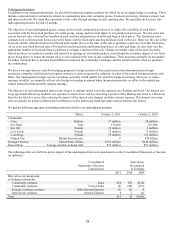
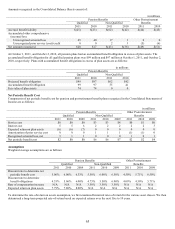
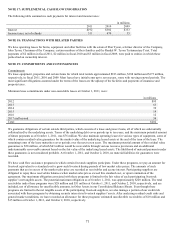
Plan Assets
The fair value of plan assets for domestic pension benefit plans was $59 million as of October 1, 2011, and October 2, 2010. The
following table sets forth the actual and target asset allocation for pension plan assets:
Target Asset
2011
2010
Allocation
Cash
1.9%
0.3%
1.0%
Fixed income securities
24.2
18.5
19.0
US Stock Funds
41.4
44.6
45.0
International Stock Funds
17.7
19.9
20.0
Real Estate
4.7
5.0
5.0
Alternatives
10.1
11.7
10.0
Total
100.0%
100.0%
100.0%
A foreign subsidiary pension plan had $15 million in plan assets at October 1, 2011 and October 2, 2010. All of this plan’s assets are
held in an insurance contract consistent with its target asset allocation.
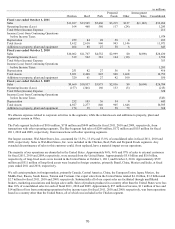
The Plan Trustees have established a set of investment objectives related to the assets of the pension plans and regularly monitor the
performance of the funds and portfolio managers. Objectives for the pension assets are (1) to provide growth of capital and income,
(2) to achieve a target weighted average annual rate of return competitive with other funds with similar investment objectives and (3)
to diversify to reduce risk. The investment objectives and target asset allocation were adopted in January 2004 and amended in
November 2008. Alternative investments may include, but not limited to, hedge funds, private equity funds and fixed income funds.
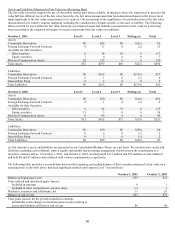
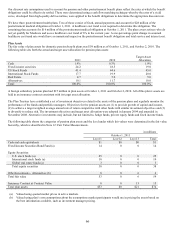
The following table shows the categories of pension plan assets and the level under which fair values were determined in the fair value
hierarchy, which is described in Note 12: Fair Value Measurements.
in millions
October 1, 2011
Level 1
Level 2
Level 3
Total
Cash and cash equivalents
$1
$0
$0
$1
Fixed Income Securities Bond Fund (a)
14
0
0
14
Equity Securities:
U.S. stock funds (a)
25
0
0
25
International stock funds (a)
10
0
0
10
Global real estate funds (a)
3
0
0
3
Total equity securities
38
0
0
38
Other Investments - Alternatives (b)
0
0
6
6
Total fair value
53
0
6
59
Insurance Contract at Contract Value
0
0
15
15
Total plan assets
$53
$0
$21
$74
(a)
Valued using quoted market prices in active markets.
(b)
Valued using plan’s own assumptions about the assumptions market participants would use in pricing the assets based on
the best information available, such as investment manager pricing.