Tyson Foods 2011 Annual Report Download - page 77
Download and view the complete annual report
Please find page 77 of the 2011 Tyson Foods annual report below. You can navigate through the pages in the report by either clicking on the pages listed below, or by using the keyword search tool below to find specific information within the annual report.-
 1
1 -
2
-
3
-
4
-
5
-
6
-
7
-
8
-
9
-
10
-
11
-
12
-
13
-
14
-
15
-
16
-
17
-
18
-
19
-
20
-
21
-
22
-
23
-
24
-
25
-
26
-
27
-
28
-
29
-
30
-
31
-
32
-
33
-
34
-
35
-
36
-
37
-
38
-
39
-
40
-
41
-
42
-
43
-
44
-
45
-
46
-
47
-
48
-
49
-
50
-
51
-
52
-
53
-
54
-
55
-
56
-
57
-
58
-
59
-
60
-
61
-
62
-
63
-
64
-
65
-
66
-
 67
67 -
 68
68 -
 69
69 -
 70
70 -
 71
71 -
 72
72 -
 73
73 -
 74
74 -
 75
75 -
 76
76 -
 77
77 -
 78
78 -
 79
79 -
 80
80 -
 81
81 -
 82
82 -
 83
83 -
 84
84 -
 85
85 -
 86
86 -
 87
87 -
88
-
89
-
90
-
91
-
92
 |
 |

77
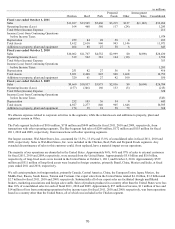
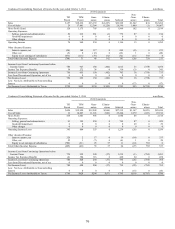
Condensed Consolidating Statement of Income for the year ended October 3, 2009
in millions
2014 Guarantors
TFI
Parent
TFM
Parent
Guar-
antors
Elimin-
ations
Subtotal
Non-
Guar-
antors
Elimin-
ations
Total
Sales
$11
$14,504
$12,245
$(725)
$26,024
$709
$(40)
$26,704
Cost of Sales
132
13,970
11,526
(725)
24,771
638
(40)
25,501
Gross Profit (Loss)
(121)
534
719
0
1,253
71
0
1,203
Operating Expenses:
Selling, general and administrative
132
187
450
0
637
72
0
841
Goodwill impairment
0
560
0
0
560
0
0
560
Other charges
0
0
17
0
17
0
0
17
Operating Income (Loss)
(253)
(213)
252
0
39
(1)
0
(215)
Other (Income) Expense:
Interest expense, net
285
13
20
0
33
(8)
0
310
Other, net
11
(3)
(6)
0
(9)
16
0
18
Equity in net earnings of subsidiaries
157
(32)
44
13
25
(17)
(165)
0
Total Other (Income) Expense
453
(22)
58
13
49
(9)
(165)
328
Income (Loss) from Continuing Operations before
Income Taxes
(706)
(191)
194
(13)
(10)
8
165
(543)
Income Tax Expense (Benefit)
(138)
111
34
0
145
0
0
7
Income (Loss) from Continuing Operations
(568)
(302)
160
(13)
(155)
8
165
(550)
Income (Loss) from Discontinued Operation, net of
tax
21
5
0
0
5
(27)
0
(1)
Net Income (Loss)
(547)
(297)
160
(13)
(150)
(19)
165
(551)
Less: Net Loss Attributable to Noncontrolling
Interest
0
0
0
0
0
(4)
0
(4)
Net Income (Loss) Attributable to Tyson
$(547)
$(297)
$160
$(13)
$(150)
$(15)
$165
$(547)
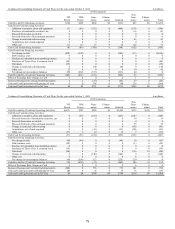
Condensed Consolidating Balance Sheet as of October 1, 2011
in millions
2014 Guarantors
TFI
Parent
TFM
Parent
Guar-
antors
Elimin-
ations
Subtotal
Non-
Guar-
antors
Elimin-
ations
Total
Assets
Current Assets:
Cash and cash equivalents
$1
$1
$414
$0
$415
$300
$0
$716
Accounts receivable, net
1
506
656
0
1,162
157
1
1,321
Inventories
2
926
1,440
0
2,366
219
0
2,587
Other current assets
62
95
102
(133)
64
54
(24)
156
Total Current Assets
66
1,528
2,612
(133)
4,007
730
(23)
4,780
Net Property, Plant and Equipment
37
875
2,369
0
3,244
542
0
3,823
Goodwill
0
881
966
0
1,847
45
0
1,892
Intangible Assets
0
31
49
0
80
69
0
149
Other Assets
2,179
180
147
(15)
312
296
(2,360)
427
Investment in Subsidiaries
11,396
1,923
769
(1,760)
932
319
(12,647)
0
Total Assets
$13,678
$5,418
$6,912
$(1,908)
$10,422
$2,001
$(15,030)
$11,071
Liabilities and Shareholders’ Equity
Current Liabilities:
Current debt
$2
$0
$0
$0
$0
$68
$0
$70
Accounts payable
8
525
648
0
1,173
83
0
1,264
Other current liabilities
5,808
144
442
(133)
453
474
(5,695)
1,040
Total Current Liabilities
5,818
669
1,090
(133)
1,626
625
(5,695)
2,374
Long-Term Debt
1,972
1,198
916
0
2,114
269
(2,243)
2,112
Deferred Income Taxes
0
120
310
(15)
415
9
0
424
Other Liabilities
231
142
191
0
333
29
(117)
476
Redeemable Noncontrolling Interest
0
0
0
0
0
0
0
0
Total Tyson Shareholders’ Equity
5,657
3,289
4,405
(1,760)
5,934
1,041
(6,975)
5,657
Noncontrolling Interest
0
0
0
0
0
28
0
28
Total Shareholders’ Equity
5,657
3,289
4,405
(1,760)
5,934
1,069
(6,975)
5,685
Total Liabilities and Shareholders’ Equity
$13,678
$5,418
$6,912
$(1,908)
$10,422
$2,001
$(15,030)
$11,071