Tyson Foods 2011 Annual Report Download - page 24
Download and view the complete annual report
Please find page 24 of the 2011 Tyson Foods annual report below. You can navigate through the pages in the report by either clicking on the pages listed below, or by using the keyword search tool below to find specific information within the annual report.-
 1
1 -
2
-
3
-
4
-
5
-
6
-
7
-
8
-
9
-
10
-
11
-
12
-
13
-
 14
14 -
 15
15 -
 16
16 -
 17
17 -
 18
18 -
 19
19 -
 20
20 -
 21
21 -
 22
22 -
 23
23 -
 24
24 -
 25
25 -
 26
26 -
 27
27 -
 28
28 -
 29
29 -
 30
30 -
 31
31 -
 32
32 -
 33
33 -
 34
34 -
35
-
36
-
37
-
38
-
39
-
40
-
41
-
42
-
43
-
44
-
45
-
46
-
47
-
48
-
49
-
50
-
51
-
52
-
53
-
54
-
55
-
56
-
57
-
58
-
59
-
60
-
61
-
62
-
63
-
64
-
65
-
66
-
67
-
68
-
69
-
70
-
71
-
72
-
73
-
74
-
75
-
76
-
77
-
78
-
79
-
80
-
81
-
82
-
83
-
84
-
85
-
86
-
87
-
88
-
89
-
90
-
91
-
92
 |
 |

24
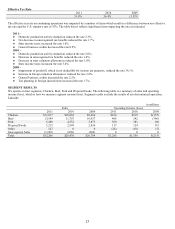
Chicken Segment Results
in millions
2011
2010
Change 2011
vs. 2010
2009
Change 2010
vs. 2009
Sales
$11,017
$10,062
$955
$9,660
$402
Sales Volume Change
4.6%
2.0%
Average Sales Price Change
4.7%
2.1%
Operating Income (Loss)
$164
$519
$(355)
$(157)
$676
Operating Margin
1.5%
5.2%
(1.6)%
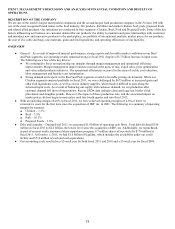
2010 – Operating income included a $38 million gain from insurance proceeds and a $29 million non-cash, non-tax deductible
charge related to a full goodwill impairment of an immaterial Chicken segment reporting unit.
2011 vs. 2010 –
●
Sales Volume – A 2.1% increase in slaughter pounds that mostly occurred in the first three quarters of fiscal 2011 and a
reduction of volumes in ending inventory in fiscal 2011 as compared to fiscal 2010, primarily drove the 4.6% increase in
sales volume for fiscal 2011.
●
Average Sales Price – The increase in average sales prices is primarily due to mix changes and price increases associated
with increased input costs.
●
Operating Income –
●
Grain, Feed Ingredients and Growout Costs – Operating results were negatively impacted in fiscal 2011 by an
increase in grain and feed ingredients costs of $675 million and an increase in other growout operating costs of $74
million.
●
Operational Improvements – Operating results were positively impacted by approximately $200 million of
operational improvements, primarily attributed to improvements in yield, mix and processing optimization. These
operational improvements were partially offset by an increase in operating costs, mostly from cooking ingredients and
employee related costs.
●
Derivative Activities – Operating results included the following amounts for commodity risk management activities
related to grain and energy purchases. These amounts exclude the impact from related physical purchase transactions,
which impact current and future period operating results.
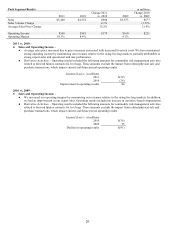
Income/(Loss) – in millions
2011
$41
2010
(6)
Improvement in operating results
$47
2010 vs. 2009 –
●
Sales Volume – The increase in sales volume for fiscal 2010 was due to sales volume related to a fiscal 2009 acquisition,
partially offset by a decrease due to the extra week in fiscal 2009.
●
Average Sales Price – The increase in average sales prices is primarily due to sales mix changes associated with the
reduced sales volume of lower price per pound rendered products.
●
Operating Income (Loss) –
●
Operational Improvements – Operating results were positively impacted by operational improvements, which
included: yield, mix and live production performance improvements; additional processing flexibility; and reduced
interplant product movement.
●
Derivative Activities – Operating results included the following amounts for commodity risk management activities
related to grain and energy purchases. These amounts exclude the impact from related physical purchase transactions,
which impact current and future period operating results.
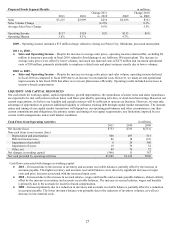
Income/(Loss) – in millions
2010
$(6)
2009
(257)
Improvement in operating results
$251
●
Grain Costs – Operating results were positively impacted in fiscal 2010 by a decrease in grain costs of $158 million.
●
Operating results included an increase in incentive-based compensation.