Tyson Foods 2011 Annual Report Download - page 43
Download and view the complete annual report
Please find page 43 of the 2011 Tyson Foods annual report below. You can navigate through the pages in the report by either clicking on the pages listed below, or by using the keyword search tool below to find specific information within the annual report.-
 1
1 -
2
-
3
-
4
-
5
-
6
-
7
-
8
-
9
-
10
-
11
-
12
-
13
-
14
-
15
-
16
-
17
-
18
-
19
-
20
-
21
-
22
-
23
-
24
-
25
-
26
-
27
-
28
-
29
-
30
-
31
-
32
-
 33
33 -
 34
34 -
 35
35 -
 36
36 -
 37
37 -
 38
38 -
 39
39 -
 40
40 -
 41
41 -
 42
42 -
 43
43 -
 44
44 -
 45
45 -
 46
46 -
 47
47 -
 48
48 -
 49
49 -
 50
50 -
 51
51 -
 52
52 -
 53
53 -
54
-
55
-
56
-
57
-
58
-
59
-
60
-
61
-
62
-
63
-
64
-
65
-
66
-
67
-
68
-
69
-
70
-
71
-
72
-
73
-
74
-
75
-
76
-
77
-
78
-
79
-
80
-
81
-
82
-
83
-
84
-
85
-
86
-
87
-
88
-
89
-
90
-
91
-
92
 |
 |

43
NOTES TO CONSOLIDATED FINANCIAL STATEMENTS
TYSON FOODS, INC.
NOTE 1: BUSINESS AND SUMMARY OF SIGNIFICANT ACCOUNTING POLICIES
Description of Business: Tyson Foods, Inc. (collectively, “Company,” “we,” “us” or “our”), founded in 1935 with world
headquarters in Springdale, Arkansas, is one of the world’s largest meat protein companies and the second-largest food production
company in the Fortune 500. We produce a wide variety of brand name protein-based and prepared food products marketed in the
United States and approximately 130 countries around the world.
Consolidation: The consolidated financial statements include the accounts of all majority-owned subsidiaries over which we exercise
control and, when applicable, entities for which we have a controlling financial interest or are the primary beneficiary. All significant
intercompany accounts and transactions have been eliminated in consolidation.
We have an investment in a joint venture, Dynamic Fuels LLC (Dynamic Fuels), in which we have a 50 percent ownership interest.
Dynamic Fuels qualifies as a variable interest entity. We consolidate Dynamic Fuels since we are the primary beneficiary. At October
1, 2011, Dynamic Fuels had $170 million of total assets, of which $144 million was property, plant and equipment, and $116 million
of total liabilities, of which $100 million was long-term debt. At October 2, 2010, Dynamic Fuels had $154 million of total assets, of
which $145 million was property, plant and equipment, and $107 million of total liabilities, of which $100 million was long-term debt.
Fiscal Year: We utilize a 52- or 53-week accounting period ending on the Saturday closest to September 30. The Company's
accounting cycle resulted in a 52-week year for fiscal years 2011 and 2010 and a 53-week year for fiscal year 2009.
Discontinued Operation: On March 13, 2009, we completed the sale of the beef processing, cattle feed yard and fertilizer assets of
three of our Alberta, Canada subsidiaries (collectively, Lakeside), which were part of our Beef segment, and related inventories. The
financial statements report Lakeside as a discontinued operation. See Note 3: Acquisitions and Discontinued Operation in the Notes to
Consolidated Financial Statements for further information.
Cash and Cash Equivalents: Cash equivalents consist of investments in short-term, highly liquid securities having original maturities
of three months or less, which are made as part of our cash management activity. The carrying values of these assets approximate their
fair values. We primarily utilize a cash management system with a series of separate accounts consisting of lockbox accounts for
receiving cash, concentration accounts where funds are moved to, and several zero-balance disbursement accounts for funding payroll,
accounts payable, livestock procurement, grower payments, etc. As a result of our cash management system, checks issued, but not
presented to the banks for payment, may result in negative book cash balances. These negative book cash balances are included in
accounts payable and other current liabilities. At October 1, 2011, and October 2, 2010, checks outstanding in excess of related book
cash balances totaled approximately $281 million and $267 million, respectively.
Accounts Receivable: We record accounts receivable at net realizable value. This value includes an appropriate allowance for
estimated uncollectible accounts to reflect any loss anticipated on the accounts receivable balances and charged to the provision for
doubtful accounts. We calculate this allowance based on our history of write-offs, level of past due accounts and relationships with
and economic status of our customers. At October 1, 2011, and October 2, 2010, our allowance for uncollectible accounts was $31
million and $32 million, respectively. We generally do not have collateral for our receivables, but we do periodically evaluate the
credit worthiness of our customers.
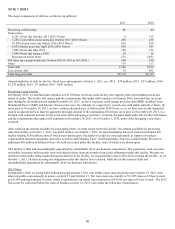
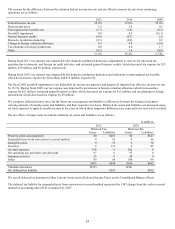
Inventories: Processed products, livestock and supplies and other are valued at the lower of cost or market. Cost includes purchased
raw materials, live purchase costs, growout costs (primarily feed, contract grower pay and catch and haul costs), labor and
manufacturing and production overhead, which are related to the purchase and production of inventories.
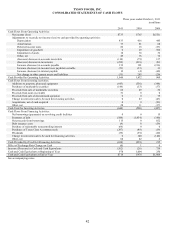
in millions
2011
2010
Processed products:
Weighted-average method – chicken and prepared foods
$715
$721
First-in, first-out method – beef and pork
581
462
Livestock – first-in, first-out method
928
759
Supplies and other – weighted-average method
363
332
Total inventory
$2,587
$2,274