Tyson Foods 2011 Annual Report Download - page 25
Download and view the complete annual report
Please find page 25 of the 2011 Tyson Foods annual report below. You can navigate through the pages in the report by either clicking on the pages listed below, or by using the keyword search tool below to find specific information within the annual report.-
 1
1 -
2
-
3
-
4
-
5
-
6
-
7
-
8
-
9
-
10
-
11
-
12
-
13
-
14
-
 15
15 -
 16
16 -
 17
17 -
 18
18 -
 19
19 -
 20
20 -
 21
21 -
 22
22 -
 23
23 -
 24
24 -
 25
25 -
 26
26 -
 27
27 -
 28
28 -
 29
29 -
 30
30 -
 31
31 -
 32
32 -
 33
33 -
 34
34 -
 35
35 -
36
-
37
-
38
-
39
-
40
-
41
-
42
-
43
-
44
-
45
-
46
-
47
-
48
-
49
-
50
-
51
-
52
-
53
-
54
-
55
-
56
-
57
-
58
-
59
-
60
-
61
-
62
-
63
-
64
-
65
-
66
-
67
-
68
-
69
-
70
-
71
-
72
-
73
-
74
-
75
-
76
-
77
-
78
-
79
-
80
-
81
-
82
-
83
-
84
-
85
-
86
-
87
-
88
-
89
-
90
-
91
-
92
 |
 |

25
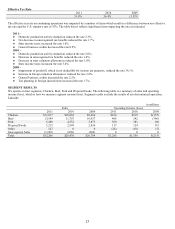
Beef Segment Results
in millions
2011
2010
Change 2011
vs. 2010
2009
Change 2010
vs. 2009
Sales
$13,549
$11,707
$1,842
$10,937
$770
Sales Volume Change
(1.0)%
(1.9)%
Average Sales Price Change
16.9%
9.1%
Operating Income (Loss)
$468
$542
$(74)
$(346)
$888
Operating Margin
3.5%
4.6%
(3.2)%
2009 – Operating loss included a $560 million non-cash charge related to the partial impairment of goodwill.
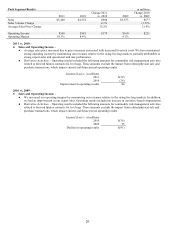
2011 vs. 2010 –
●
Sales and Operating Income –
●
Average sales price increased due to price increases associated with increased livestock costs. We have maintained
strong operating income by maximizing our revenues relative to the rising live cattle markets, partially attributable to
strong export sales. This was offset by an increase in operating costs, primarily attributable to employee related costs.
●
Derivative Activities – Operating results included the following amounts for commodity risk management activities
related to forward futures contracts for live cattle. These amounts exclude the impact from related physical sale and
purchase transactions, which impact current and future period operating results.
Income/(Loss) – in millions
2011
$(41)
2010
(15)
Decline in operating results
$(26)
2010 vs. 2009 –
●
Sales and Operating Income (Loss) –
●
We increased our operating margins by maximizing our revenues relative to the rising live cattle markets, as well as
improved our operating costs.
In addition, we had an improvement in our export sales.
Operating results included an
increase in incentive-based compensation.
●
Derivative Activities – Operating results included the following amounts for commodity risk management activities
related to forward futures contracts for live cattle. These amounts exclude the impact from related physical sale and
purchase transactions, which impact current and future period operating results.
Income/(Loss) – in millions
2010
$(15)
2009
102
Decline in operating results
$(117)