Tyson Foods 2011 Annual Report Download - page 49
Download and view the complete annual report
Please find page 49 of the 2011 Tyson Foods annual report below. You can navigate through the pages in the report by either clicking on the pages listed below, or by using the keyword search tool below to find specific information within the annual report.-
 1
1 -
2
-
3
-
4
-
5
-
6
-
7
-
8
-
9
-
10
-
11
-
12
-
13
-
14
-
15
-
16
-
17
-
18
-
19
-
20
-
21
-
22
-
23
-
24
-
25
-
26
-
27
-
28
-
29
-
30
-
31
-
32
-
33
-
34
-
35
-
36
-
37
-
38
-
 39
39 -
 40
40 -
 41
41 -
 42
42 -
 43
43 -
 44
44 -
 45
45 -
 46
46 -
 47
47 -
 48
48 -
 49
49 -
 50
50 -
 51
51 -
 52
52 -
 53
53 -
 54
54 -
 55
55 -
 56
56 -
 57
57 -
 58
58 -
 59
59 -
60
-
61
-
62
-
63
-
64
-
65
-
66
-
67
-
68
-
69
-
70
-
71
-
72
-
73
-
74
-
75
-
76
-
77
-
78
-
79
-
80
-
81
-
82
-
83
-
84
-
85
-
86
-
87
-
88
-
89
-
90
-
91
-
92
 |
 |

49
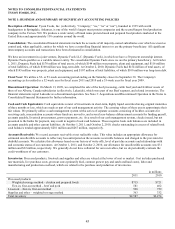
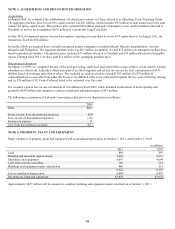
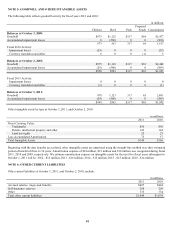
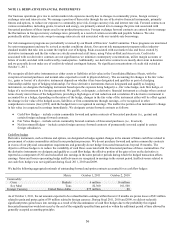
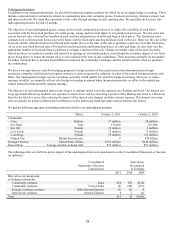
NOTE 5: GOODWILL AND OTHER INTANGIBLE ASSETS
The following table reflects goodwill activity for fiscal years 2011 and 2010:
in millions
Chicken
Beef
Pork
Prepared
Foods
Consolidated
Balances at October 3, 2009:
Goodwill
$973
$1,123
$317
$64
$2,477
Accumulated impairment losses
0
(560)
0
0
(560)
973
563
317
64
1,917
Fiscal 2010 Activity:
Impairment losses
(29)
0
0
0
(29)
Currency translation and other
6
0
0
(1)
5
Balances at October 2, 2010:
Goodwill
$979
$1,123
$317
$63
$2,482
Accumulated impairment losses
(29)
(560)
0
0
(589)
$950
$563
$317
$63
$1,893
Fiscal 2011 Activity:
Impairment losses
0
0
0
0
0
Currency translation and other
(1)
0
0
0
(1)
Balances at October 1, 2011:
Goodwill
978
1,123
317
63
2,481
Accumulated impairment losses
(29)
(560)
0
0
(589)
$949
$563
$317
$63
$1,892
Other intangible assets by type at October 1, 2011, and October 2, 2010:
in millions
2011
2010
Gross Carrying Value:
Trademarks
$56
$56
Patents, intellectual property and other
143
144
Land use rights
25
23
Less Accumulated Amortization
75
57
Total Intangible Assets
$149
$166
Beginning with the date benefits are realized, other intangible assets are amortized using the straight-line method over their estimated
period of benefit of three to 30 years. Amortization expense of $18 million, $19 million and $10 million was recognized during fiscal
2011, 2010 and 2009, respectively. We estimate amortization expense on intangible assets for the next five fiscal years subsequent to
October 1, 2011 will be: 2012 - $16 million; 2013 - $16 million; 2014 - $15 million; 2015 - $15 million; 2016 - $14 million.
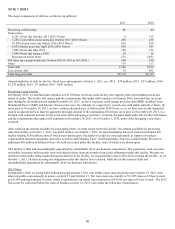
NOTE 6: OTHER CURRENT LIABILITIES
Other current liabilities at October 1, 2011, and October 2, 2010, include:
in millions
2011
2010
Accrued salaries, wages and benefits
$407
$444
Self-insurance reserves
298
256
Other
335
334
Total other current liabilities
$1,040
$1,034